'Without a poverty line, how are we to know whether poverty is the same, or it has come down or it has gone up?'
A few days ago, NITI Aayog CEO B V R Subrahmanyam made a startling claim that India's poverty level has fallen below 5% in 2024.
According to him, the Household Consumption Expenditure Survey 2022-2023 (HCES) survey indicates that people are becoming more prosperous in both urban and rural areas.
Subrahmanyam didn't corroborate his claims with any data.
His claim gave the ruling Bharatiya Janata Party and the media houses that support the government, a reason to blow the trumpet.
But how far is the claim close to reality?
"The claim is more political with the elections in mind." economist Dr Santosh Mehrotra, visiting Professor of Development Economics, Centre for Development Studies, University of Bath, UK, tells Rediff.com's Shobha Warrier.
Quoting the HCES survey, the NITI Ayog CEO said poverty has fallen below 5%. Did this come as a surprise to you?
First, It is the NITI Aayog CEO, B V R Subramanyam, who said that. There is no basis for him to make such claims.
What does he mean by saying poverty has fallen below 5% as if it was X% earlier and now it is 5%? I don't know how he came to this conclusion.
What is the poverty line? Who is above the poverty line and who is below the poverty line?
He is not even an economist; he is an IAS officer who happens to be the CEO of NITI Aayog. And his claim doesn't mean it is a fact.
My question is, did the HCES document give you any basis for making such claims?
I have rejected the claim because the 2012 data and the 2023 data are incomparable.
The question critics ask is, how can poverty fall when job growth and real wages have come down?
From 2004-2005 to 2011-2012, there was an unmistakable and sustained rise in real wages but wages stagnated between 2013 and 2017.
Joblessness grew from 10 million in 2011-2012 to nearly 38 million in 2022.
If 106.1 million workers were earning just up to Rs 100 per day (in real terms at 2010 prices) and can be categorised as absolute poor in 2011-2012, the number rose to 190 million in 2021-2022.
Another fact is, there has been a massive surge in the number of poor workers in recent times.
Those who earn between Rs 100 and Rs 200 per day are categorised as poor and vulnerable, and in 2021-2022, the number was in 2017-2018 141.0 million. By 2021-2022 that number rose to 179 million.
Those who earn between Rs 200 and Rs 300 per day can be categorised as non-poor but definitely vulnerable, and the number is 151.7 million workers in 2021-2022, having risen from 141 million in 2017-2018
As the number of working poor and the decline in real wages indicate a different story, there is no basis in the claims made by the CEO, NITI Aqyog.
The HCES survey, it seems, used a different methodology to come to such a conclusion...
This is the problem with the IAS officers. They think they know everything.
Then, the newspapers and the godi media carry it. Why do they have to carry such baseless claims?
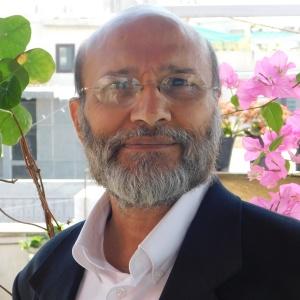
IMAGE: Dr Santosh Mehrotra
How different is this methodology?
First, in HCES 2022-2023, the sampling methodology has undergone a significant change.
If the previous surveys were made based on household status and household activity for rural areas and monthly per-capita income for urban areas, the second stage stratum classification in the HCES survey used land for rural areas and car availability for urban areas.
The sampling method has changed significantly.
The number of products for which consumption expenditure is estimated has increased by one sixth.
Now three visits are being made instead of the one visit to the same household earlier.
These changes in the sampling and methodology make the 2012 and 2023 surveys non-comparable.
The government also has not spoken about the claims by the NITI Aayog CEO as what he said was to their advantage. But the Opposition asked, if poverty had fallen below 5%, why was the government giving free food grains to 813 million people for the next 5 years?
The question the Opposition asked is quite valid.
There is ambiguity in the government's stand also.
They are not saying the NITI CEO is right, they are also not saying he is wrong.
So they are in the best of both the worlds. However, other government economists have begun to make similar baseless claims.
So we should not be surprised if by the time electioneering begins, the poverty claim would be echoed by the senior most political class in government.
Without verifying the facts, the media just repeated what Mr Subramanyam said.
Another question is, if poverty has fallen below 5%, why is it that India is at 111th position out of 125 countries in the 2023 global hunger index?
See, there is a standard methodology that is used all over the world.
If the government doesn't like the methodology used by world agencies, what about the National Family Health survey done by an Indian organisation?
It says malnutrition is at 32% which means 1/3rd of children in India is malnourished.
It also says 35% of India's children have stunted growth, and the body mass index of 20% adult Indians is less than 18.5 which means they are malnourished.
Is the data of government's own institutions wrong?
The HCE survey says consumption expenditure is rising. When wages are stagnated, how can poverty reduce?
On what basis can anyone claim that consumption expenditure is rising?
The consumption expenditure is stated in HCE survey in current prices; it's not in constant prices.
The NSO (National Survey Organisation) doesn't claim that consumption is rising.
See, when economic growth happens, the share of food expenditure in total household expenditure should come down. But the current food expenditure share in total expenditure in India is 46.38% for rural households and 39.17% for urban households. You compare this with the 6.4% for the USA and 6.9% for Singapore.
The share of food expenditure falling only means that there is a slight reduction of food in total expenditure, releasing some space for non-food expenditure – a good things.
However, they are just stating the total expenditure in current prices, and no claims about poverty falling are tenable.
It doesn't tell you that people are consuming more or consuming less.
Another thing the survey highlights is people are spending less on food and more on other items.. What exactly does it mean? That people have more money?
It could mean that they have more money. But with GDP growth, incomes do rise.
We don't know, however, whether the total expenditure is higher or lower.
We don't know because they have not calculated the inflation rate.
With the current inflation rate, total expenditure is going to be higher. But it doesn't mean you are consuming more.
It could mean your total consumption expenditure in real terms is the same but the share of different items have changed.
It is just that proportional relative changes may have taken place.
You mean, it doesn't mean poverty has fallen, but the spending pattern has changed...?
Yes. It doesn't mean poverty has fallen. It doesn't mean consumption has risen.
It just means there are changes in the spending pattern in relative terms. Some things have gone up and some things have come down.
A rise in the money spent on food doesn't mean people have more money – since they have not adjusted rupee values of consumption of specific items by the rate of inflation.
Nowhere are they telling you that people are consuming say, more milk or less milk.
But the most important thing is, are you taking inflation into account?
Do you feel the claim made by the CEO of NITI Ayog based on the HCES survey more political?
Of course, the claim is more political with the elections in mind.
Would you say we don't have enough data to show where we stand as far as poverty is concerned?
Yes, where is the data?
They have deliberately changed the methodology.
What will happen now is, the previous estimates of poverty are meaningful only in a historical perspective.
Because you have changed the methodology, you cannot make a comparison of the times during the UPA and the NDA.
They only want to use MPI (Multidimensional Poverty Index). That's their goal and game plan from the beginning; that HCES data shouldn't be comparable.
If they had wanted these estimates to be comparable, they would not have changed the methodology dramatically.
Now, they want to tell the whole world that the real poverty estimate is MPI, and we have done brilliantly on MPI.
So, they do not want people to see the real picture?
Right. By changing the methodology, you cannot compare the current figures with the earlier ones.
They claim that poverty is down below 5%. But you haven't said what the poverty line was in the last 10 years.
Without a poverty line, how are we to know whether poverty is the same, or it has come down or it has gone up?
So, there is no basis in the claim that poverty is down by 5%.
Feature Presentation: Rajesh Alva/Rediff.com




 © 2025