Rajneesh Gupta highlights the important numbers of the Australian team from World Cups.
Result Summary
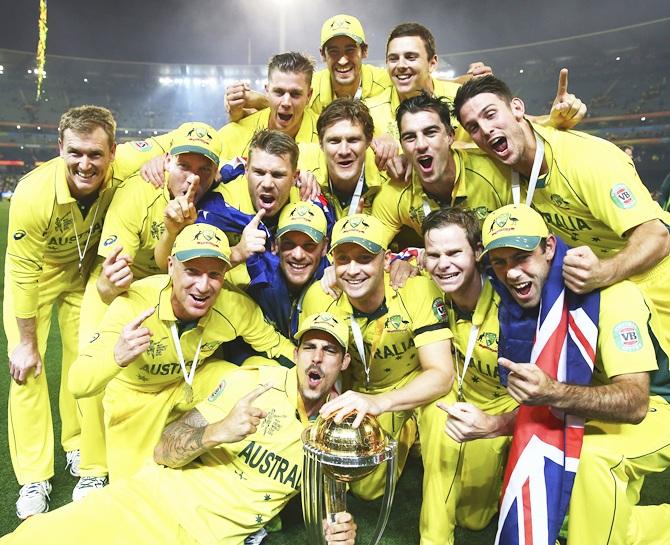
IMAGE: The Australians celebrate with the 2015 World Cup. Photograph: Ryan Pierse/Getty Images
| Year | Matches | Won | Lost | Tied | No Result | Remarks |
|---|---|---|---|---|---|---|
| 1975 | 5 | 3 | 2 | 0 | 0 | Runner-up |
| 1979 | 3 | 1 | 2 | 0 | 0 | Could not qualify for semi finals |
| 1983 | 6 | 2 | 4 | 0 | 0 | Could not qualify for semi finals |
| 1987 | 8 | 7 | 1 | 0 | 0 | Champions |
| 1992 | 8 | 4 | 4 | 0 | 0 | Could not qualify for semi finals |
| 1996 | 7 | 5 | 2 | 0 | 0 | Runner-up |
| 1999 | 10 | 7 | 2 | 1 | 0 | Champions |
| 2003 | 11 | 11 | 0 | 0 | 0 | Champions |
| 2007 | 11 | 11 | 0 | 0 | 0 | Champions |
| 2011 | 7 | 4 | 2 | 0 | 1 | Lost in quarter-finals |
| 2015 | 8 | 7 | 1 | 0 | 0 | Champions |
| Total | 84 | 62 | 20 | 1 | 1 |
Playing Record against Participating Teams
| Versus | Matches | Won | Lost | Tied | No Result | Win% |
|---|---|---|---|---|---|---|
| Afghanistan | 1 | 1 | 0 | 0 | 0 | 100.00 |
| Bangladesh | 2 | 2 | 0 | 0 | 0 | 100.00 |
| England | 7 | 5 | 2 | 0 | 0 | 71.42 |
| India | 11 | 8 | 3 | 0 | 0 | 72.72 |
| New Zealand | 10 | 7 | 3 | 0 | 0 | 70.00 |
| Pakistan | 9 | 5 | 4 | 0 | 0 | 55.55 |
| South Africa | 5 | 3 | 1 | 1 | 0 | 60.00 |
| Sri Lanka | 9 | 7 | 1 | 0 | 1 | 87.50 |
| West Indies | 9 | 4 | 5 | 0 | 0 | 44.44 |
Highest Team Totals
| Total | Vs | Venue | Year |
|---|---|---|---|
| 417/6 | Afghanistan | Perth | 2015 |
| 377/6 | South Africa | Basseterre | 2007 |
| 376/9 | Sri Lanka | Sydney | 2015 |
| 359/2 | India | Johannesburg | 2003 |
| 358/5 | Netherlands | Basseterre | 2007 |
Lowest Team Totals
| Total | Vs | Venue | Year |
|---|---|---|---|
| 129 | India | Chelmsford | 1983 |
| 151 | West Indies | Leeds | 1983 |
| 151 | New Zealand | Auckland | 2015 |
| 159/9 | England | Lord's | 1979 |
| 170/9 | South Africa | Sydney | 1992 |
Highest Individual Innings

IMAGE: After a horrific year on the sidelines, David Warner will be keen to reclaim his reputation. Photograph: Paul Kane/Getty Images
| Runs | Player | Vs | Venue | Year |
|---|---|---|---|---|
| 178 | David Warner | Afghanistan | Perth | 2015 |
| 158 | Matthew Hayden | West Indies | North Sound | 2007 |
| 149 | Adam Gilchrist | Sri Lanka | Bridgetown | 2007 |
| 143* | Andrew Symonds | Pakistan | Johannesburg | 2003 |
| 140* | Ricky Ponting | India | Johannesburg | 2003 |
| 135 | Aaron Finch | England | Melbourne | 2015 |
| 130 | Mark Waugh | Kenya | Visakhapatnam | 1996 |
| 126* | Geoff Marsh | New Zealand | Chandigarh | 1987 |
| 126 | Mark Waugh | India | Mumbai | 1996 |
| 123 | Brad Hodge | Netherlands | Basseterre | 2007 |
| 120* | Steve Waugh | South Africa | Leeds | 1999 |
| 114 | Ricky Ponting | Sri Lanka | Centurion | 2003 |
| 113 | Ricky Ponting | Scotland | Basseterre | 2007 |
| 110 | Geoff Marsh | India | Madras | 1987 |
| 110 | Mark Waugh | New Zealand | Madras | 1996 |
| 110 | Trevor Chappell | India | Nottingham | 1983 |
| 105 | Steve Smith | India | Sydney | 2015 |
| 104 | Ricky Ponting | India | Ahmedabad | 2011 |
| 104 | Mark Waugh | Zimbabwe | Lord's | 1999 |
| 103 | Matthew Hayden | New Zealand | St George's | 2007 |
| 102 | Glenn Maxwell | Sri Lanka | Sydney | 2015 |
| 102 | Ricky Ponting | West Indies | Jaipur | 1996 |
| 101 | Alan Turner | Sri Lanka | The Oval | 1975 |
| 101 | Matthew Hayden | South Africa | Basseterre | 2007 |
| 100 | David Boon | New Zealand | Auckland | 1992 |
| 100 | David Boon | West Indies | Melbourne | 1992 |
Leading Run-scorers
| Matches | Runs | Highest Score | Average | Strike Rate | 100 | 50 | |
|---|---|---|---|---|---|---|---|
| Ricky Ponting | 46 | 1,743 | 140* | 45.86 | 79.84 | 5 | 6 |
| Adam Gilchrist | 31 | 1,085 | 149 | 36.16 | 98.01 | 1 | 8 |
| Mark Waugh | 22 | 1,004 | 130 | 52.84 | 83.59 | 4 | 4 |
| Matthew Hayden | 22 | 987 | 158 | 51.94 | 92.93 | 3 | 2 |
| Steve Waugh | 33 | 978 | 120* | 48.90 | 80.49 | 1 | 6 |
| Michael Clarke | 25 | 888 | 93* | 63.42 | 94.16 | 0 | 8 |
| David Boon | 16 | 815 | 100 | 54.33 | 72.96 | 2 | 5 |
| Shane Watson | 22 | 643 | 94 | 53.58 | 108.06 | 0 | 6 |
| Dean Jones | 16 | 590 | 90 | 42.14 | 72.57 | 0 | 5 |
| Geoff Marsh | 13 | 579 | 126* | 48.25 | 58.60 | 2 | 2 |
| Michael Bevan | 26 | 537 | 74* | 44.75 | 64.23 | 0 | 5 |
| Andrew Symonds | 18 | 515 | 143* | 103.00 | 93.29 | 1 | 3 |
Highest Partnership for each wicket
| Wicket | Runs | Players | Venue | Year |
|---|---|---|---|---|
| 1st | 183 | Shane Watson and Brad Haddin | v Canada (Bengaluru) | 2011 |
| 2nd | 260 | David Warner and Steve Smith | Afghanistan (Perth) | 2015 |
| 3rd | 234* | Ricky Ponting and Damien Martyn | India (Johannesburg) | 2003 |
| 4th | 204 | Michael Clarke and Brad Hodge | Netherlands (Basseterre) | 2007 |
| 5th | 160 | Glenn Maxwell and Shane Watson | Sri Lanka (Sydney) | 2015 |
| 6th | 99 | Ross Edwards and Rod Marsh | West Indies (The Oval) | 1975 |
| 7th | 70* | Darren Lehmann and Brad Hogg | v Namibia (Potchefstroom) | 2003 |
| 8th | 97 | Michael Bevan and Andy Bichel | New Zealand (Port Elizabeth) | 2003 |
| 9th | 73* | Michael Bevan and Andy Bichel | England (Port Elizabeth) | 2003 |
| 10th | 45 | Brad Haddin and Pat Cummins | New Zealand (Auckland) | 2015 |
Best Bowling in a match
| Wicket/Runs | Player | Vs | Venue | Year |
|---|---|---|---|---|
| 7/15 | Glenn McGrath | v Namibia | Potchefstroom | 2003 |
| 7/20 | Andy Bichel | England | Port Elizabeth | 2003 |
| 6/14 | Gary Gilmour | England | Leeds | 1975 |
| 6/28 | Mitchell Starc | New Zealand | Auckland | 2015 |
| 6/39 | Ken MacLeay | India | Nottingham | 1983 |
| 5/14 | Glenn McGrath | West Indies | Manchester | 1999 |
| 5/21 | Alan Hurst | v Canada | Birmingham | 1979 |
| 5/33 | Mitchell Marsh | England | Melbourne | 2015 |
| 5/34 | Dennis Lillee | Pakistan | Leeds | 1975 |
| 5/36 | Damien Fleming | India | Mumbai | 1996 |
| 5/42 | Brett Lee | New Zealand | Port Elizabeth | 2003 |
| 5/44 | Craig McDermott | Pakistan | Lahore | 1987 |
| 5/48 | Gary Gilmour | West Indies | Lord's | 1975 |
Leading Bowlers

IMAGE: The magnificent Glenn McGrath. Photograph: Shaun Botterill/Getty Images
| Matches | Wickets | Average | Runs Per Over | Best | 4W | |
|---|---|---|---|---|---|---|
| Glenn McGrath | 39 | 71 | 18.19 | 3.96 | 7/15 | 2 |
| Brett Lee | 17 | 35 | 17.97 | 4.57 | 5/42 | 3 |
| Brad Hogg | 21 | 34 | 19.23 | 4.12 | 4/27 | 2 |
| Shaun Tait | 18 | 34 | 21.50 | 5.35 | 4/39 | 1 |
| Shane Warne | 17 | 32 | 19.50 | 3.83 | 4/29 | 4 |
| Craig McDermott | 17 | 27 | 22.18 | 4.02 | 5/44 | 2 |
| Steve Waugh | 33 | 27 | 30.14 | 4.70 | 3/36 | 0 |
| Damien Fleming | 16 | 26 | 22.42 | 4.37 | 5/36 | 1 |
| Mitchell Johnson | 15 | 25 | 22.28 | 4.60 | 4/19 | 3 |
Most Appearances
| Matches | Years | |
|---|---|---|
| Ricky Ponting | 46 | 1996-2011 |
| Glenn McGrath | 39 | 1996-2007 |
| Steve Waugh | 33 | 1987-1999 |
| Adam Gilchrist | 31 | 1999-2007 |
| Michael Bevan | 26 | 1996-2003 |
| Allan Border | 25 | 1979-1992 |
| Michael Clarke | 25 | 2007-2015 |
Most Captaincies
| Captain | Played | Won | Lost | Tied | No Result | Win% |
|---|---|---|---|---|---|---|
| Ricky Ponting | 29 | 26 | 2 | 0 | 1 | 92.85 |
| Allan Border | 16 | 11 | 5 | 0 | 0 | 68.75 |
| Steve Waugh | 10 | 7 | 2 | 1 | 0 | 70.00 |
| Kim Hughes | 8 | 3 | 5 | 0 | 0 | 37.50 |
| Michael Clarke | 7 | 6 | 1 | 0 | 0 | 85.71 |
| Mark Taylor | 7 | 5 | 2 | 0 | 0 | 71.42 |








 © 2025