In comparison to other asset classes, globally, gold rallied significantly after many years to deliver 18.4 per cent returns in 2019.

The Reserve Bank of India (RBI) bought 7.5 tonnes of gold towards the end of 2019, making its gold reserves swell to 625 tonnes, a new record.
Data from the World Gold Council (WGC) indicates that in 2019 many central banks showed more confidence in gold (Chart 1).

India’s story is visible in Chart 2, where in the last six months, the growth in reserves in the form of gold, at 27 per cent, was way higher than the overall growth.

An appreciation in gold price would result in faster growth in India’s forex reserves now.
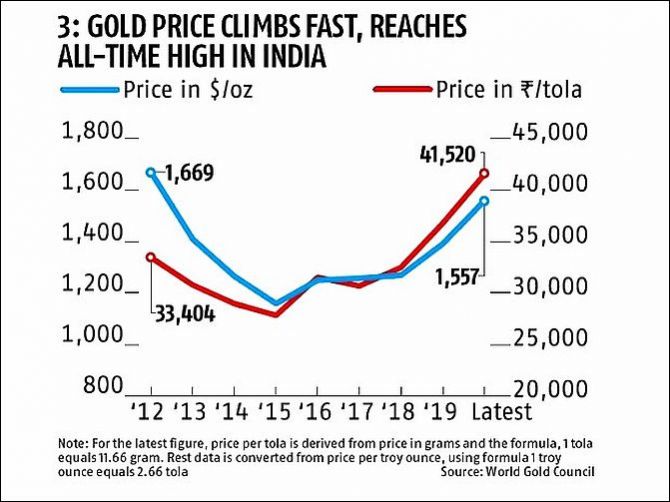
Chart 3 shows how gold rallied in 2019, and the current spike in January, owing to geopolitical tensions in West Asia.

While it is nearing its previous peak in US dollar terms, gold touched an all-time high in rupee terms this month.
Globally, however, gold price had peaked in 2012, when the rupee was stronger against the dollar than what it is today.
In comparison to other asset classes, globally, gold rallied significantly after many years to deliver 18.4 per cent returns in 2019 (Chart 4), higher than stock markets, such as in India and China, and corporate bonds in the US.

Gold prices went more in Turkish Lira and Indian rupee among a range of currencies (Chart 5).

Returns on gold are closely co-correlated with global interest rates.
A negative interest rate regime gives higher returns on gold, a WGC study notes (Chart 6).

No wonder gold rallied in 2019 with global monetary easing (Chart 7).

In 2019, the RBI eased the policy repo rate by 135 basis points, bringing down the real interest rate in the economy.
Accommodative monetary policy stance of large central banks may help gold in 2020 as well.


 © 2025