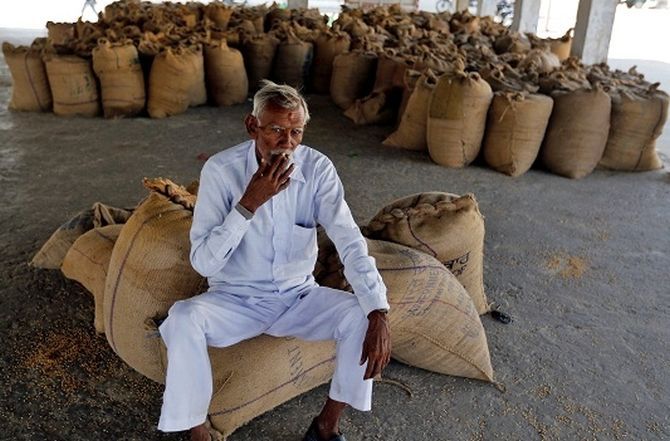
The sample size of 8,100 farmers across 19 states has not changed in the last three decades, and the methodology of the sample survey too remains unchanged

Consider this. Tur, or arhar, a major crop consumed across India in the form of tur dal, is cultivated by about 10 lakh farmers in Karnataka.
But the Department of Agriculture surveys only 89 tur/arhar farmers in the southern state to determine the average cost of tur cultivation.
Though the sample of farmers surveyed to determine the cultivation cost for some crops is sufficient, according to agriculture ministry officials, the sample size for most crops is not just insufficient, but the entire sample survey is riddled with a three-decade old methodology.
The sample size of 8,100 farmers across 19 states has not changed in the last three decades, and the methodology of the sample survey too remains unchanged, officials from the agriculture department told Business Standard.
A senior official said while the proposal to revise the procedure of determining crop production costs has been discussed, the ministry decided not to undertake it in a pre-election year.
He also added that the sample size needs to be about 23,000-25,000, and the methodology needs to take into account several changes that have occurred in the long period.
“The marketed surplus ratio (MSR), input costs to farmers, cropping pattern, and the import-export matrix, have all undergone phenomenal change in three decades,” he said.
From the produce harvested from the farm, an average Indian farmer saves a portion for household consumption, and sells the remainder, termed as marketed surplus, in the local market or the Agriculture Produce Marketing Committee mandi.
MSR has increased for major crops, while for some crops like soyabean, production has skyrocketed but the MSR has reduced over the decades.
The quantum of India’s agricultural exports has also changed over the decades.
From 0.9 per cent of India’s gross domestic product (GDP) in 1999-00, the share of farm exports in GDP increased to about 2 per cent in 2011-13, to reduce to 1.1 per cent in 2017-18.
The change in crop matrix can be ascertained from the simple fact that subsistence crops, known as nutri-cereals, such as jowar and bajra constituted about 16 per cent of kharif crop production in 2003, which reduced to 8 per cent in 2017.
The reduction in net area sown under these crops is even faster, say farm experts.
At the same time, the area under sugarcane, soyabean and cotton has risen, whose input costs have evolved over time.
The Directorate of Economics & Statistics defines cost of cultivation (CoC) as money spent per hectare of crop cultivated, and cost of production (CoP) as money required to produce unit weight of the farm produce.
Both being directly related to each other, CoP was used as a basis to calculate the MSP by the Commission for Agricultural Costs & Prices till last year.
The Ramesh Chand Committee report on the efficacy of the MSP had recommended that state governments should be consulted on MSP determination, and that the fair average quality norms for arrived crops should be relaxed for farmers, so that more and more farmers can sell the harvest at MSP, among other important recommendations.
But officials said that the committee had a generic focus on the MSP mechanism, and most of its recommendations are still not implemented.
They said that a comprehensive panel with the sole focus to revamp the methodology to calculate cost of production is needed.
Photograph: Reuters


 © 2025