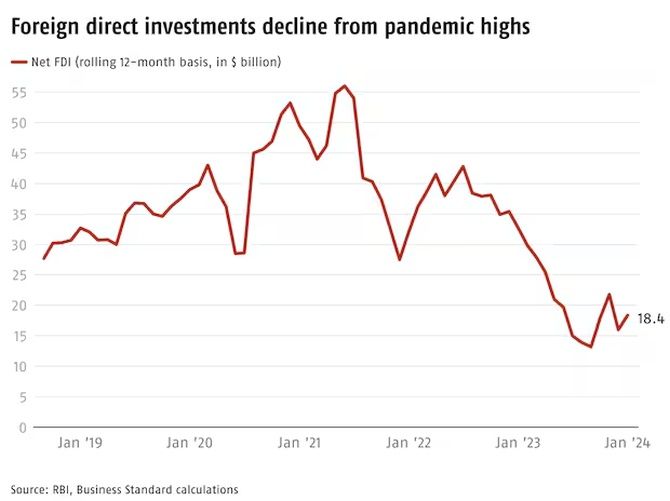
Net inflows were $18.4 billion for the rolling 12-month period ended January 2024 compared to $32.7 billion for the rolling 12-month period ended January 2023.
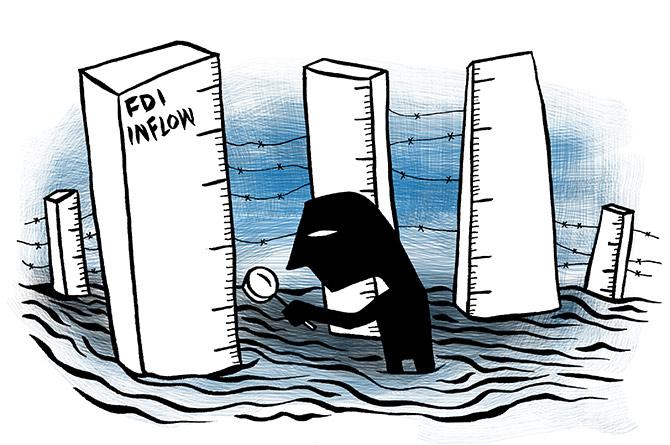
The current financial year will likely close with a lower level of foreign direct investments (FDI) than the previous one.
Net inflows were $18.4 billion for the rolling 12-month period ended January 2024, according to data from the Reserve Bank of India.
It was higher at $32.7 billion for the rolling 12-month period ended January 2023 (chart 1).
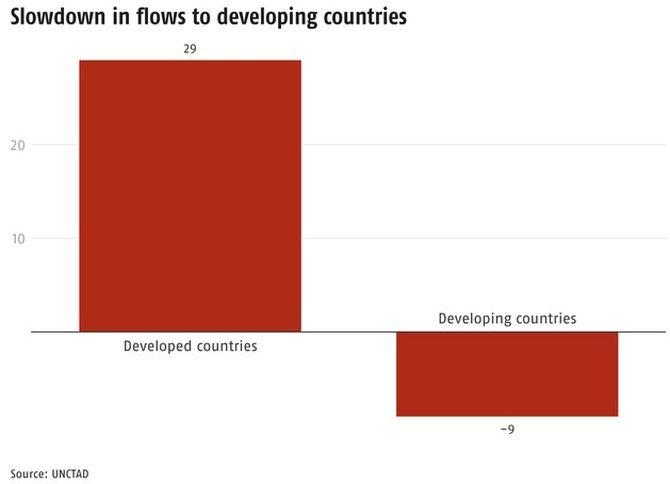
However, this is in line with a global investment slowdown.
Developing countries have been most affected, according to international data (chart 2).
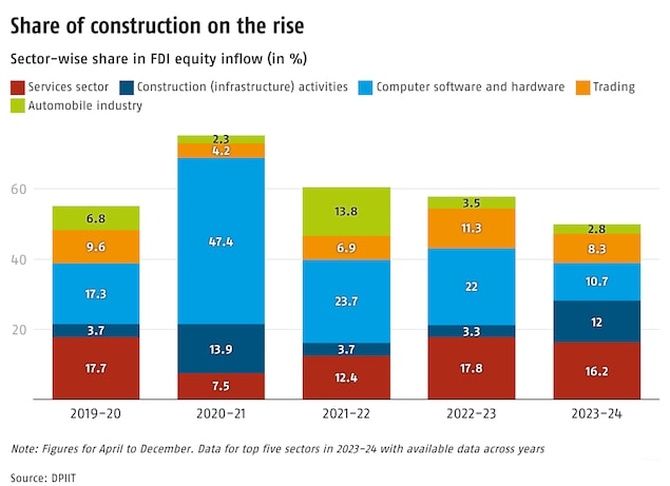
The services sector, which includes financial, banking, insurance, outsourcing and others, accounted for the highest share of equity inflows in 2023-2024 (till December), according to data from the Department for Promotion of Industry and Internal Trade (DPIIT).
The sharpest change has been in the construction segment involved in infrastructure activities.
The share of this segment in FDI flows has risen to 12 per cent so far this financial year compared to 3.3 per cent seen in the previous one (chart 3).
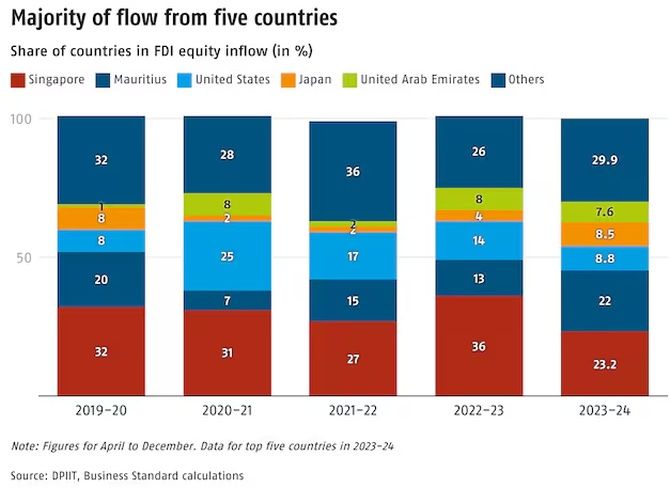
The majority of the equity investment in 2023-24 was by five countries, with Singapore (23.2 per cent) leading, followed by Mauritius (22 per cent), the United States (8.8 per cent), Japan (8.5 per cent) and the United Arab Emirates (7.6 per cent) (chart 4).
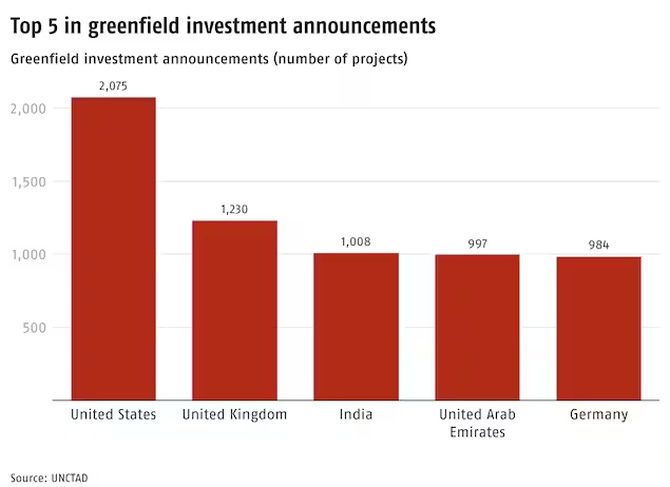
Despite the decline, India was among the top five countries for greenfield projects, according to the United Nations Conference on Trade and Development (Unctad) World Investment Report 2023, a position it has retained according to the latest Unctad figures (chart 5).
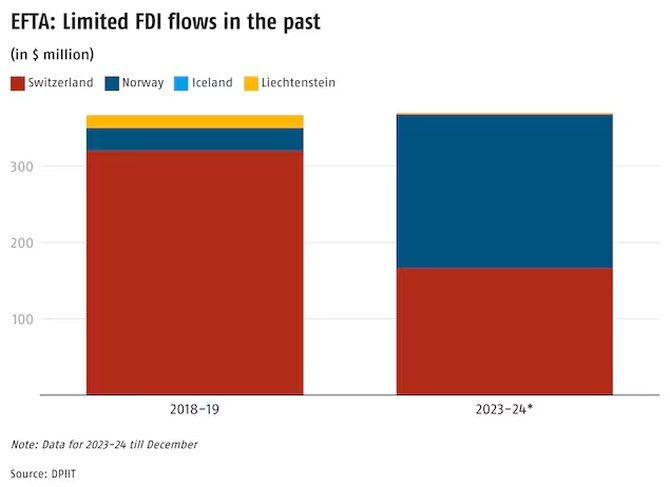
Recently, India signed a trade agreement with a group of four countries, Iceland, Liechtenstein, Norway and Switzerland, which will invest $100 billion in 15 years.
Data shows that these four countries, which together form the European Free Trade Association (EFTA), have invested less than 2 per cent of FDI coming into India, or under $400 million annually (chart 6).
Feature Presentation: Rajesh Alva/Rediff.com




 © 2025