The slowdown in the Indian economy could get prolonged as lead indicators are not suggesting an immediate revival, reports Abhishek Waghmare.
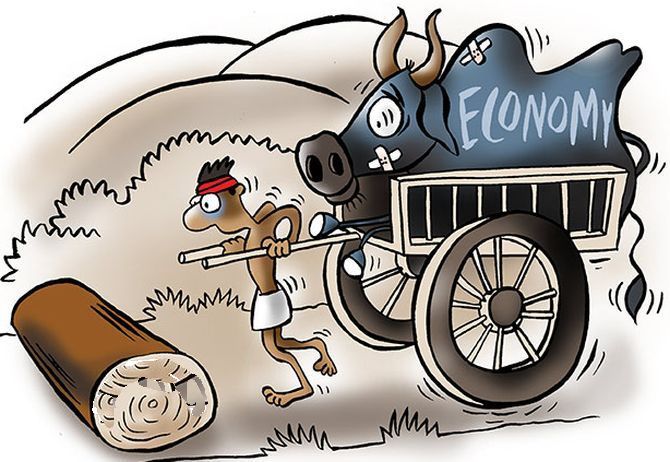
Illustration: Uttam Ghosh/Rediff.com

The Indian economy slowed sharply in the first quarter of the current financial year, latest data released by the National Statistics Office jas showed.
This was the time when India voted to re-elect the National Democratic Alliance government at the Centre.
The magnitude of the slowdown was massive: In nominal terms, India's gross domestic product (GDP) grew by 7.99 per cent, lowest since December 2002 (Chart 1), if we refer to the national accounts series in use in respective periods.

In real terms, which takes into account the impact of inflation, India's GDP grew by 5 per cent, while the gross value added grew at 4.9 per cent (Chart 2).

The biggest mover in the economy, investment, grew at sub 5 per cent for two consecutive quarters (Chart 3).

Investment is crucial for economic growth and job creation.
In terms of share, however, investments stayed at near 30 per cent of GDP.
Consumption slowdown became more palpable, as private consumption expenditure grew at the slowest rate, at least since demonetisation.
Though government spending grew at 8.8 per cent, it wasn't enough to contain the dampness in other parts of the economy (Chart 4).

The manufacturing sector continued to underperform -- similar to what had happened in the 2013-15 period.
But in the June quarter, the service sector also slowed (Chart 5).

Construction and the farm sector remained subdued as well (Chart 6).

These two sectors are important because they employ a large number of people.
The slowdown in the Indian economy could get prolonged as lead indicators are not suggesting an immediate revival.


 © 2025