'Given that the economy is going through a slowdown, further downward revisions of the 2019-2020 growth estimates cannot be ruled out,' notes A K Bhattacharya.

Another round of serious questioning over the reliability of India's national income data has begun because of the manner in which significant downward revisions were made to the growth numbers for the first, second and third quarters of 2019-2020.
The first quarter growth rate was brought down from 5.6 per cent to 5.2 per cent, but the numbers for the second and third quarters were scaled down even more steeply -- from 5.1 per cent to 4.4 per cent for the second quarter and from 4.7 per cent to 4.1 per cent for the third quarter.
The outcome was inevitable.
With fourth quarter growth estimated at 3.1 per cent, the annual growth of gross domestic product for 2019-2020, released on May 29 as Provisional Estimates, was scaled down from the earlier estimate of 5 per cent to 4.2 per cent.
The only explanation the Central Statistics Office gave for the revision in these numbers was contained in a bland statement: 'Estimates including growth rates of Q1, Q2 and Q3 of 2019-20 released earlier have been revised in accordance with the revision policy of National Accounts.'
The lack of proper explanation was disturbing.
What made it worse was the CSO's clarification that these quarterly and annual estimates could change again in view of the COVID-19 pandemic and the lockdown, which has disrupted the data flow from economic entities.
The CSO expected more data to come in from many units that could not submit production information earlier because of the lockdown and would be updated in the revised numbers to be out in the coming months.
Perhaps there would have been less disquiet over such data revisions if they had taken place under exceptional circumstances such as the current one.
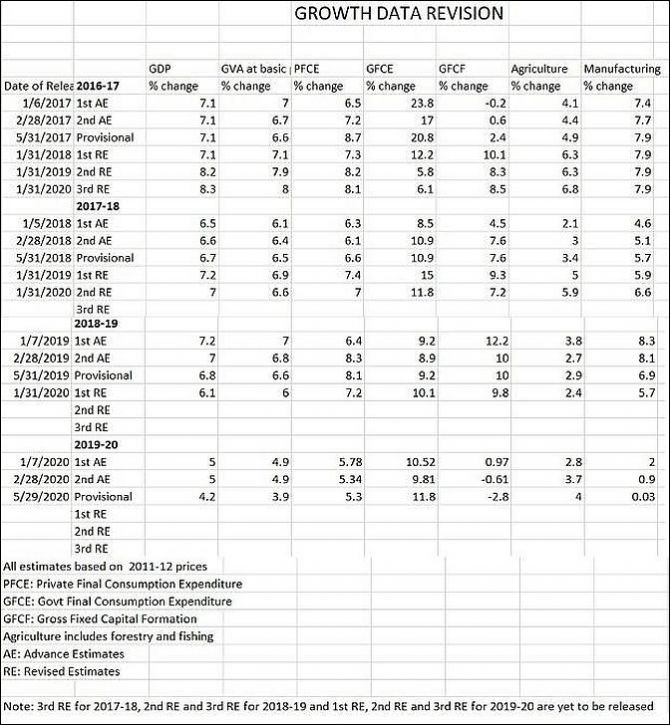
The problem is that such revisions have become almost routine (please see table).
That is why the debate over the reliability of India's naional income data keeps surfacing.

The flexibility and scope the CSO enjoys in making such revisions are huge.
Its calendar for national income data release for a particular financial year is spread over 36 months.
In this long period, the GDP estimate for the same year goes through six iterations, each of which offers the CSO an opportunity to revise the data not just for the full year, but also for any of its four quarters.
Usually, the First Advance Estimates of GDP for a year is released in January, about two-and-a-half months before the end of that financial year.
By February, the Second Advance Estmates for the year is also out.
Three months later, in May, the Provisional Estimates for the just-concluded year is released.
For the fourth iteration of the same GDP number for the same year, one has to wait till next January.
This is called the First Revised Estimates.
Two more iterations of the same number, called the Second Revised Estimates and the Third Revised Estimates, are released over the next two years with a gap of one year each.
Few other countries follow such a long-winded process of revising economic output data.
The US, for instance, has only three iterations of the GDP data for a period and these are released within just three months.
But in India, it is this long period of data release with six iterations that results in mind-boggling confusion for policymakers.
Which GDP data should they use for framing their policies?
For instance, in January 2017, the GDP data for 2016-2017 was pegged at 7.1 per cent.
Three years later, the GDP growth for that year was revised upwards to 8.3 per cent.
Something similar happened with the GDP data for 2017-2018.
In January 2018, the growth was estimated at 6.5 per cent, but two years later in January 2020, the Second Revised Estimates put the growth at 7 per cent.
It is unclear if the Third Revised Estimates, to be out in January 2021, will revise this number again.
The trajectory of the 2016-2017 and 2017-2018 revisions was in tune with what had happened in previous years.
A 2018 Reserve Bank of India study brought out how the earlier iterations of economic output growth tended to underestimate the real growth as captured in subsequent revisions.
This was 'mainly because firmer data are captured in successive rounds of revisions accompanied with gradual increase in data coverage,' the study noted.
The RBI study pointed to another important trend.
It had observed that there were substantial upward revisions in the years coinciding with the upturns in the Indian economy, -- during 2005-2006 and 2009-2010, and a huge downward revision in the year of the global financial crisis, 2008-2009.
Not surprisingly, the trajectory of data revisions has changed from 2018-2019 and that continues even for 2019-2020.
The First Advance Estimates for 2018-2019 pegged GDP growth at 7.2 per cent, but this was revised downwards to 6.1 per cent by the time the First Revised Estimates were announced a year later.
Given that the economy is going through a slowdown, further downward revisions of the 2019-2020 growth estimates cannot be ruled out.
The CSO's explanation for these revisions sheds some light on their reasons.
For revisions in 2016-2017, it says the changes resulted from updated estimates of production and prices of some crops, livestock products, fish and forestry items, use of final results of the Annual Survey of Industries data and updated information on local bodies and autonomous institutions.
Similar reasons such as updating information received from various economic entities, including state government Budgets were cited for revising the 2017-2018 and 2018-2019 numbers.
But these reasons also convey a sombre message.
There is likely to be no early relief from the uncertainty caused by six revisions of economic output data for the same year, which are released over a period of three years.
Until and unless the CSO reduces the number of revisions and the time period in which they are released, policymakers and analysts will have to continue to live with the current uncertainty and suitably adjust their understanding of the economy by comparing the GDP numbers with other high-frequency indicators of the real economy.


 © 2025