 | « Back to article | Print this article |
Mumbai, Delhi among 30 cities with the richest people
Despite a gloomy economic scenario, there was room for wealth creation in 2012.
The number of people with $30 million or more in net assets (referred to throughout this report as HNWIs) rose by 5 per cent last year, or nearly 8,700, according to data by Wealth-X, a wealth intelligence firm.
The combined wealth held by HNWIs also grew by 2 per cent, or $566 billion, to just over $26 trillion in 2012.
Over the next 10 years, 95,000 people are forecast to break the $30 million wealth barrier – a cumulative 50% rise, which will take the total number of HNWIs across the globe to around 285,665.
The number of HNWIs in India is expected to more than double over the next 10 years, rising by 137 per cent in Mumbai alone.
This will give India - along with China and Japan - the highest number of HNWIs in Asia by 2022, says a Knight Frank report.
Click NEXT to see the top 30 global cities by HNWI population...
New York, United States
Rank: 1
2012: 7,580
2022: 10,306
Change: 36%
Click NEXT to read more...
Mumbai, Delhi among 30 cities with the richest people
London, United Kingdom
Rank: 2
2012: 6,015
2022: 8,202
Change: 36%
Mumbai, Delhi among 30 cities with the richest people
Tokyo, Japan
Rank: 3
2012: 5,440
2022: 6,763
Change: 24%
Mumbai, Delhi among 30 cities with the richest people
San Francisco, United States
Rank: 4
2012: 4,590
2022: 6,665
Change: 45%
Click NEXT to read more...
Mumbai, Delhi among 30 cities with the richest people
Los Angeles, United States
Rank: 5
2012: 4,520
2022: 6,075
Change: 34%
Click NEXT to read more...
Mumbai, Delhi among 30 cities with the richest people
Beijing, China
Rank; 6
2012: 2,285
2022: 5,262
Change:130%
Click NEXT to read more...
Mumbai, Delhi among 30 cities with the richest people
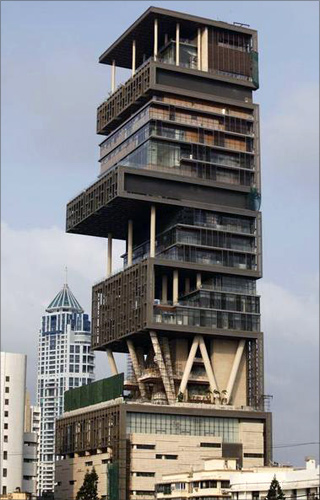
Mumbai, India
Rank: 7
2012: 2,105
2022: 4,988
Change: 137%
Click NEXT to read more...
Mumbai, Delhi among 30 cities with the richest people
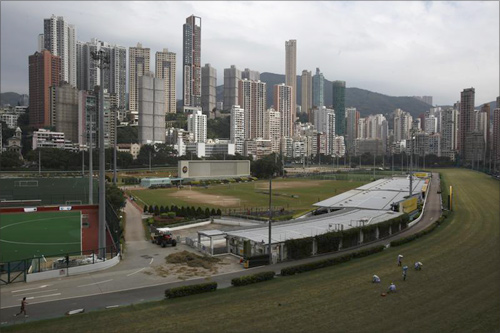
Hong Kong
Rank: 8
2012: 3,205
2022: 4,780
Change: 49%
Click NEXT to read more...
Mumbai, Delhi among 30 cities with the richest people
Sao Paulo, Brazil
Rank: 9
2012: 1,880
2022: 4,566
Change: 143%
Click NEXT to read more...
Mumbai, Delhi among 30 cities with the richest people
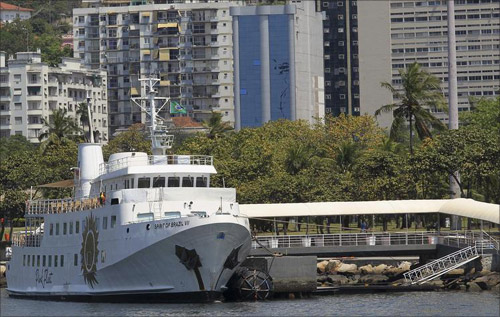
Rio De Janeiro, Brazil
Rank: 10
2012: 1,740
2022: 4,285
Change: 146%
Click NEXT to read more...
Mumbai, Delhi among 30 cities with the richest people
New Delhi, India
Rank: 11
2012: 1,945
2022: 4,278
Change: 120%
Click NEXT to read more...
Mumbai, Delhi among 30 cities with the richest people
Mexico City, Mexico
Rank: 12
2012: 2,585
2022: 3,901
Change: 51%
Click NEXT to read more...
Mumbai, Delhi among 30 cities with the richest people
Osaka, Japan
Rank: 13
2012: 2,970
2022: 3,813
Change: 28%
Click NEXT to read more...
Mumbai, Delhi among 30 cities with the richest people
Shanghai, China
Rank: 14
2012: 1,415
2022: 3,704
Change:162%
Click NEXT to read more...
Mumbai, Delhi among 30 cities with the richest people
Chicago, United States
Rank: 15
2012: 2,615
2022: 3,689
Change: 41%
Click NEXT to read more...
Mumbai, Delhi among 30 cities with the richest people
Paris, France
Rank: 16
2012: 2,860
2022: 3,672
Change: 28%
Click NEXT to read more...
Mumbai, Delhi among 30 cities with the richest people
Houston, United States
Rank: 17
2012: 2,295
2022: 3,397
Change: 48%
Click NEXT to read more...
Mumbai, Delhi among 30 cities with the richest people
Washington DC, United States
Rank: 18
2012: 2,395
2022: 3,188
Change: 33%
Click NEXT to read more...
Mumbai, Delhi among 30 cities with the richest people
Dallas, United States
Rank: 19
2012: 2,020
2022: 2,927
Change: 45%
Click NEXT to read more...
Mumbai, Delhi among 30 cities with the richest people
Toronto, Canada
Rank: 20
2012: 1,765
2022: 2,367
Change: 34%
Click NEXT to read more...
Mumbai, Delhi among 30 cities with the richest people
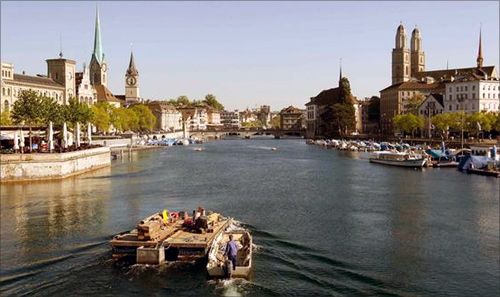
Zurich, Switzerland
Rank: 21
2012: 1,805
2022: 2,333
Change: 29%
Click NEXT to read more...
Mumbai, Delhi among 30 cities with the richest people
Munich, Germany
Rank: 22
2012: 1,670
2022: 2,117
Change: 27%
Click NEXT to read more...
Mumbai, Delhi among 30 cities with the richest people
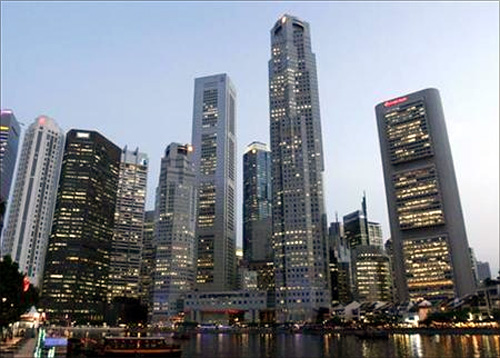
Singapore
Rank: 23
2012: 1,345
2022: 1,930
Change: 43%
Click NEXT to read more...
Mumbai, Delhi among 30 cities with the richest people
Sydney, Australia
Rank: 24
2012: 1,405
2022: 1,925
Change: 37%
Click NEXT to read more...
Mumbai, Delhi among 30 cities with the richest people
Dusseldorf, Germany
Rank: 25
2012: 1,420
2022: 1,872
Change: 32%
Click NEXT to read more...
Mumbai, Delhi among 30 cities with the richest people
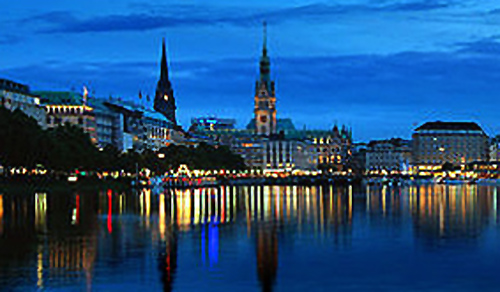
Hamburg, Germany
Rank: 26
2012: 1,370
2022: 1,788
Change:31%
Click NEXT to read more...
Mumbai, Delhi among 30 cities with the richest people
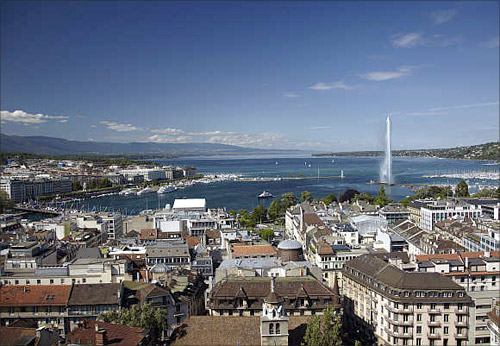
Geneva, Switzerland
Rank: 27
2012: 1,360
2022: 1,724
Change: 27%
Click NEXT to read more...
Mumbai, Delhi among 30 cities with the richest people
Melbourne, Australia
Rank: 28
2012: 1,150
2022: 1,621
Change: 41%
Click NEXT to read
Mumbai, Delhi among 30 cities with the richest people
Frankfurt, Germany
Rank: 29
2012: 1,220
2022: 1,562
Change: 28%
Click NEXT to read more...
Mumbai, Delhi among 30 cities with the richest people
Rome, Italy
Rank: 30
2012: 1,130
2022: 1,351
Change: 20%

