 | « Back to article | Print this article |
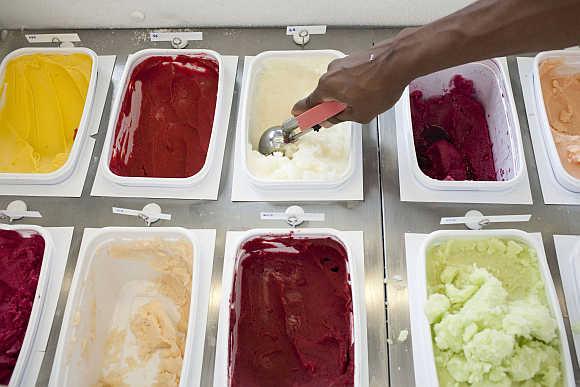
Ice cream consumption in India and rest of the world
Almost all Indians love ice cream, but where do we rank in per capita consumption compared to the rest of the world?
Let's take a look at the global ranking based on research conducted by Unilever.
Click NEXT to read more...
Ice cream consumption in India and rest of the world
New Zealand
Per capita consumption: 28.4 litres per year
Global rank: 1
Click NEXT to read more...
Ice cream consumption in India and rest of the world
The United States
Per capita consumption: 20.8 litres per year
Global rank: 2
Click NEXT to read more...
Ice cream consumption in India and rest of the world
Australia
Per capita consumption: 18 litres per year
Global rank: 3
Click NEXT to read more...
Ice cream consumption in India and rest of the world
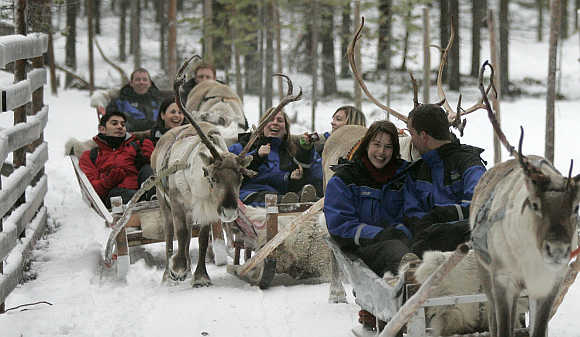
Finland
Per capita consumption: 14.2 litres per year
Global rank: 4
Click NEXT to read more...
Ice cream consumption in India and rest of the world
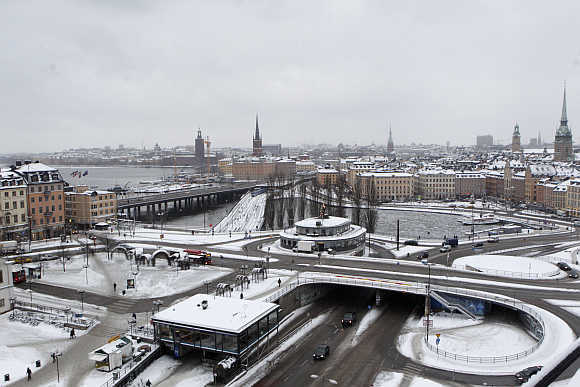
Sweden
Per capita consumption: 12 litres per year
Global rank: 5
Click NEXT to read more...
Ice cream consumption in India and rest of the world
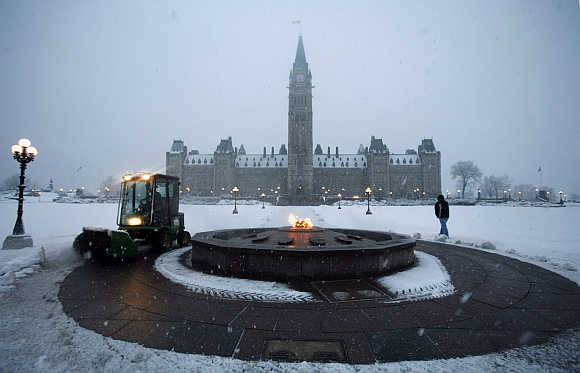
Canada
Per capita consumption: 10.6 litres per year
Global rank: 6
Click NEXT to read more...
Ice cream consumption in India and rest of the world
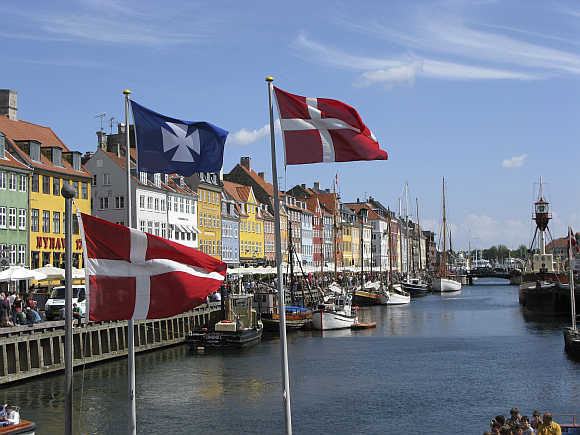
Denmark
Per capita consumption: 9.8 litres per year
Global rank: 7
Click NEXT to read more...
Ice cream consumption in India and rest of the world
Ireland
Per capita consumption: 8.4 litres per year
Global rank: 8
Click NEXT to read more...
Ice cream consumption in India and rest of the world
Italy
Per capita consumption: 8.0 litres per year
Global rank: 9
Click NEXT to read more...
Ice cream consumption in India and rest of the world
The United Kingdom
Per capita consumption: 7.0 litres per year
Global rank: 10
Click NEXT to read more...
Ice cream consumption in India and rest of the world
Singapore
Per capita consumption: 2.4 litres per year
Global rank: 11
Click NEXT to read more...
Ice cream consumption in India and rest of the world
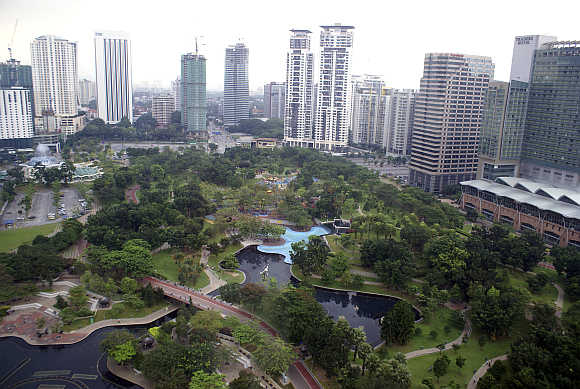
Malaysia
Per capita consumption: 1.9 litres per year
Global rank: 12
Click NEXT to read more...
Ice cream consumption in India and rest of the world
Thailand
Per capita consumption: 1.5 litres per year
Global rank: 13
Click NEXT to read more...
Ice cream consumption in India and rest of the world
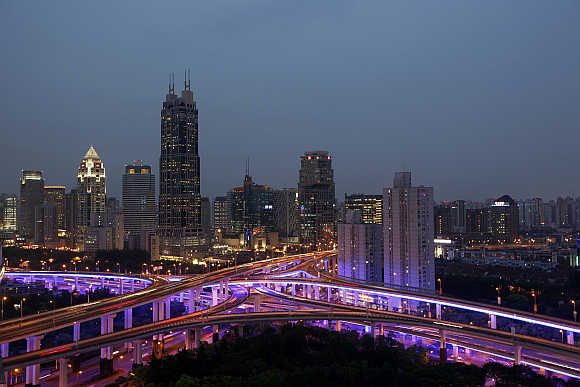
China
Per capita consumption: 1.0 litres per year
Global rank: 14
Click NEXT to read more...
Ice cream consumption in India and rest of the world
The Philippines
Per capita consumption: 0.8 litres per year
Global rank: 15
Click NEXT to read more...
Ice cream consumption in India and rest of the world
Pakistan
Per capita consumption: 0.4 litres per year
Global rank: 16
Click NEXT to read more...
Ice cream consumption in India and rest of the world
Indonesia
Per capita consumption: 0.1 litres per year
Global rank: 17
Click NEXT to read more...
Ice cream consumption in India and rest of the world
India
Per capita consumption: 0.1 litres per year
Global rank: 18
