Proceeding to analyse the data and then publish a book that lucidly explains the relationship between these variables is a mammoth exercise.
Dr Rajesh Shukla, Director of the recently launched NCAER-Centre for Macro Consumer Research (NCAER-CMCR), has done exactly that in How India Earns, Saves and Spends: Unmasking the Real India (published by Sage), a scholarly book which maps the earning, saving and spending profiles of Indians in the post-liberalisation era.
The book, based on data generated by the National Survey of Household Income and Expenditure, NSHIE, offers an opportunity to India's policy makers, marketers and researchers to evolve policies to engender meaningful inclusion in the national economic growth story.
In an interview with Rediff.com's Prasanna D Zore, Dr Shukla discusses the reasons behind undertaking the ambitious project and points out how it could help planners in government and the private sector take advantage of the trends they were hardly aware of earlier.
He also warns of the possible social repercussions in the event of our failing to include the more than 200 million Indians who till now have been excluded from economic security.
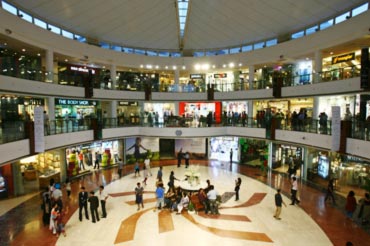
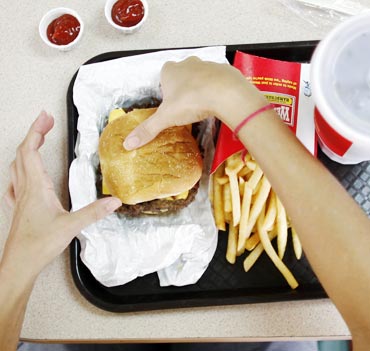
'Even conservative housewives in ghoonghats are eating chow mein'
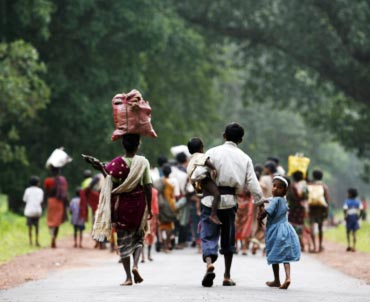
Image: Image used only for representational purposesPhotographs: Carlos Barria/Reuters
The change is huge. The most important thing that has changed post-liberalisation is the structure of the Indian economy.
In the 1970s, India earned 70 per cent of its GDP from agriculture. Today this has reduced to 20 per cent.
The income generation mechanism in the country underwent huge change after 1991.
More than 50 per cent of our GDP now comes from the services sector. So, implicitly, our economic dependence on uncertainty has changed.
Within services, households in modern services, that is, sectors like construction, transport, communication, real estate, retail, etc, have reaped the maximum advantage.
Thanks to road, media and telecom connectivity between urban and rural areas the spread of education in India's heartland has improved tremendously.
Indian society in the last two decades has become more literate, knowledgeable.
When people are more knowledgeable they benefit from various resources -- both public and private -- at their disposal.
This has led to an improvement in people's lifestyle in terms of consumption.
Earlier, a typical Indian household in urban areas would spend 60 per cent of their annual income on food. Post-liberalisation, the share of food expenses in the overall expense a family incurs in urban areas has come down to 30 per cent or so.
While we are still a consumption-led society, the way and the goods we consume have changed a lot after 1991.
Before 1991, it was typical of parents to book a car or a scooter three years before a daughter's marriage. Long waiting periods didn't automatically translate into timely delivery.
Today if you have Rs 10,000 in your pocket you can purchase a motorbike even on your way home from office.
Services, options and choices at the disposal of the Indian consumer have undergone a huge change after liberalisation.
Even conservative middle class housewives who would never come out of their ghoonghat are visiting food joints to eat dosa and Chinese chow mein.
After 1991, the top 20 per cent of India's population has drawn the maximum benefits from economic liberalisation.
In the earlier age, this small but influential section of the population did not perhaps get enough opportunities for contributing to national growth as well as meeting their aspirations.
This happened because this set of Indians had the skill sets to take advantage of economic reforms. Again, the national picture has transformed dramatically.
You now have high consumption states and low consumption states. The households in high-income states hold 78 per cent, middle income states 61 per cent and low income states 43 per cent of their respective surplus income as liquid cash.
Physical investments by these household groups are at the rates of 14, 24 and 41 per cent respectively.
Let me add a word of caution though: It's not all hunky dory.
If the top 20 per cent account for 50 per cent of the income and the bottom 20 per cent of the pyramid earn only 7 to 8 per cent of the income, then I believe it is a recipe for future problems.
While the incomes of all Indians across different socio-economic strata have changed in the last 19 years maximum gain was reported in the top 20 per cent.
While the top 20 per cent of this group has grown at a rate of 12 to 13 per cent per annum in real terms the bottom of the pyramid grew only at 5 to 6 per cent.
'People with skills are raking in the moolah'
Image: Cover: How India Earns, Spends and Saves; Inset: Dr Rajesh ShuklaPhotographs: Parth Sanyal/Reuters
If you look at a labourer's typical workday, he puts in eight hours of work.
During this time, if he earned Rs 70 before 1991, today he is earning Rs 100; tomorrow he will earn Rs 120 per day.
You can imagine the condition of the bottom 20 per cent of the income pyramid with this kind of growth rate in earnings. It doesn't bring any meaningful change in their lifestyle.
But for the upper strata of society with knowledge and skills at their disposal, the same length of time produces qualitatively different results.
Not only are they earning more but they continue working even after getting back home.
For example, a teacher can put in eight hours in the school or college which puts him on the payroll, and then go to give classes in some professional institute or coaching centre.
An engineer can earn extra by putting in just an hour's work into his CAD-CAM enabled computer at home.
So, it's clear that people with skills are raking in the moolah.
Secondly, post-1991 income growth has not happened uniformly across India.
While the rural areas are still dominated by occupations connected to agriculture and the same old unskilled jobs, urban centres have seen much infrastructure growth which has transformed them into attractive destinations for all sorts of professionals.
On the savings front, one could say that the role of the informal sector has undergone much change.
Because of the expansion of financial infrastructure to rural areas, village households now depend less on private moneylenders.
NREGA has changed the saving patterns in rural areas to a great extent. But then, this is happening slowly.
The poor, who keep 40 per cent of their annual earnings at home, don't open a bank account because they fear that middlemen may take advantage of their illiteracy and rob them of their meagre savings.
To that extent, financial inclusion in terms of participation is not happening as expected.
Even if a large number of people are now going to banks, the old fears are not vanishing fast enough.
Our survey has brought out the fact that when they go to deposit Rs 500 in a bank they take along somebody who knows banking procedures because there is a lurking fear that their money may be deposited into somebody else's account.
Second, the daily wage earners in the rural hinterland waste almost a day when they travel 8 to 10 km back and forth to a bank to deposit their money.
Then they waste another day if they need to withdraw money from their bank accounts.
This, in turn, leads to a drop in monthly income.
However, even in rural areas we have been noticing that poor people are slowly showing their faith and confidence in the financial infrastructure.
Because of the coming to power of leaders like Mulayam Singh Yadav and Mayawati a lot of backward class and backward caste people are showing newfound confidence in modern financial systems, resulting in inclusion.
This is a positive development.
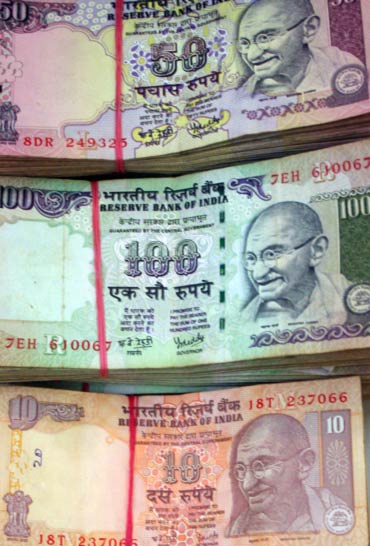
'81 per cent of families stash away money for a rainy day'
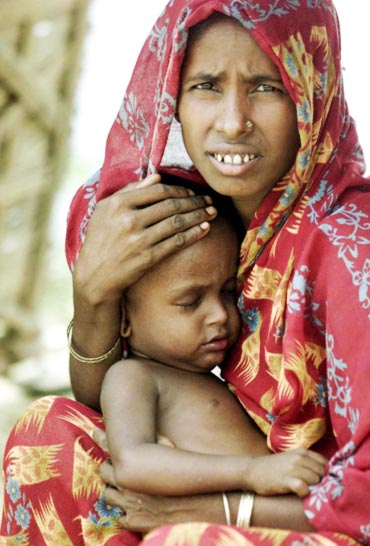
Image: Image used only for representational purposesPhotographs: Sanjay Sawant/Rediff.com
Indian households have come a long way during a 20-year period that has seen dramatic changes in the way Indians live, earn, consume and save.
And to truly understand the potential of Indian households it is necessary to map them in terms of their earning and spending patterns.
What are the factors that determine the income of a household and thereby it's saving and expenditure trends?
This book seeks to explore this question. The level of well-being is dependent on a whole host of factors -- ranging from occupation to education and location of households.
The book has focused on discerning the differences in the income levels associated with certain demographic and socio-economic characteristics of the chief earners and households.
In respect of the chief earner, his occupation, education and age have significant bearing on his income, spending and saving levels.
The sectors of employment, major sources of income, state of residence are also critical in ascertaining income, expenditure and saving levels in different parts of the country.
Let me qualify. Firstly, the Indian economy is no longer as agriculture-led as it was up to the 1970s.
Services are now the main engine.
Today, over 42 per cent of rural households draw their income from non-farm sources, particularly traditional services.
The impetus for investment is increasingly on the private sector and public-private partnerships in infrastructure.
So, hard data on the manifold aspects of consumption is essential for the evolution of corporate long-term investment strategies.
Our book has this information, which could help them understand the patterns of incomes, savings and spending of people at all socio-economic levels.
This book highlights the fact that 40 per cent of savings in rural households are kept at home instead of banks.
This puts these households at the risk of opportunity cost as this money is not yielding them anything.
Now imagine the impact on the Indian economy as well as on the people if these moneys could be ploughed into life insurance or bank fixed deposits?
For example, imagine a labourer saving Rs 1,000 in a year and keeping this money at home.
If we find a way to channelise a part of this money into health or life insurance, it would protect him and his family from undesirable risks as well as lead to a boom for the insurance sector and logical spinoffs for the economy at large.
But, as of now, this is a non-existent market. When a medical emergency hits them, they borrow Rs 25,000 or more from a private moneylender and keep on repaying the sum with a huge interest burden for the next 3 to 4 years.
This is an unnecessary waste from the point of view of both the consumer and government-industry.
With annual savings of Rs 1,000, the poor in rural India could easily buy health or life covers to protect their dependents.
Our data would be useful to marketers as well as government policy makers achieve financial inclusion.
What is most significant is that we have brought out a sense of unrealistic optimism despite the fact that 81 per cent of (Indian) households have the habit of stashing away money for a rainy day.
About 96 per cent of the savers said they were aware that the quantum of their savings wouldn't last them beyond a year in the event of their losing an income source.
Now, come to food security, affirmative action, NREGA, and other platforms. The data at the government's command presently is abysmal.
What's the most efficient way to plan government programmes and consolidate existing ones?
Hard, reliable data of course, which no institution can possibly match us in terms of breadth of field, depth of experience, etc.
How India Earns Spends and Saves could help Indian policymakers understand India's aam admi better and compel them to target their allocations better.
'Increasing income inequality is not good for India'
Image: Image used only for representational purposesPhotographs: Sucheta Das/Reuters
The first key highlight is there is the reflection in it of a marked increase in income inequality in India in the post-liberalisation era.
In this respect we are fast closing in on China which is now seeing iniquity of dangerous levels.
This is not a good sign for a country like India.
Perhaps realising this, the government has drawn up extensive and intensive programmes for inclusion.
NREGA and Food Security are good beginnings.
Whatever the flip sides manifested, it cannot be denied that economic liberalisation and financial inclusion have benefited the masses.
But these, as yet, are disproportionately skewed in favour of the top 20 per cent of the pyramid.
The gini co-efficient (a metric for measuring inequality -- an increase in gini co-efficient indicates increase in the level of inequality) was 0.37 in 1995-96.
Currently (the data collated is for 2004-05) it is hovering in the range of 0.43 to 0.44.
In 2003, The World Bank put the China figure at 0.45.
In the second phase of economic liberalisation after 2001 a lot of opportunities were made available, but only to the top of the pyramid.
This led to increases in the per capita earnings of people in the upper income quintiles.
The second highlight is that we have tried to clear a lot of doubts and confusion over non-farm income contribution.
We had a drought-like situation last year and an economic slowdown, but yet the sales of fast moving consumer goods increased. This confounded a lot of policy makers.
Third, it provides huge scope for understanding what needs to be done to make financial inclusion more efficient.
It highlights that Indian households -- both rural and urban -- are not saving for retirement but for children's education, health needs and for buying houses.
This, in a way, provides a light to show the direction that financial inclusion must happen to make the exercise more meaningful for the targeted people.
I think roti-kapda-makaan, combined with swastha (health) offers much scope to Indian marketers as there exists a huge and untapped market at the bottom of the income pyramid.
If the marketers address this market it would serve two things: one -- the share of services in our national income would go up, and, two -- we would develop into a more mature and developed society.
This book also tries to demolish a few myths.
People are not overtly concerned about old age, but more concerned about the well being of the future generations.
And this is a huge sign of development for our government, policy makers and marketers.
The other myth is that the rural market is just an extension of the urban market.
The rural market is a completely different entity, with lifestyles entirely different compared to that of the top 20 cities of India.
The potential of drawing bonanza from this huge market with the help of accurate information on income and spending patterns cannot be overstated.
'Hardly 13 per cent of households have a graduate as chief earner'
Image: Image used only for representational purposesPhotographs: Vijay Mathur/Reuters
When you consider education, you see its superiority over other factors on income patterns, something no previous survey has brought out.
Hardly 13 per cent of households have a graduate as chief earner, but such families account for 28 per cent of the total income.
If you look at occupation patterns, a different animal emerges.
Our book has tried to map the consumer base using different sets of demographics, socio-economic indicators, regional mapping, state-wise distribution and rural-urban mapping.
In the process we have served India's policy makers and marketers a diversified as well as holistic understanding of Indians' savings, earnings and spending patterns.
I believe it would be helpful to both sets of people bring more Indians into the economic mainstream. It could enable corporate houses service those sections of Indians which are yet un-serviced.
Such data could help in meaningful implementation of government policies and help them make informed decisions.
You may agree that the government is facing criticism from all, including the media, over the way in which they implement programmes of public good.
There are lot of gaps, leakages and waste. Reports like this one could help plug leakages and waste.
Let me add that our data was not collated and conceptualised in isolation. It was done under the controlled supervision of the government machinery, involving people from NSSO (the National Sample Survey Organisation) and the Planning Commission in the advisory committee set up under the project.
Information is not the be-all and end-all.
Its credibility is the issue. With government involvement, acceptability follows automatically because in India institutions still tend to look out for the official seal of approval.
'Government must make the poor feel secure'
Image: Image used only for representational purposesPhotographs: Jayanta Shaw/Reuters
What could be the social repercussions of such a high increase in income inequality?
For a populous country like India, the impact cannot be imagined.
If the government doesn't meet the economic and social needs of the majority of the people, then there could be widespread social unhappiness or even unrest as the disaffected masses begin to assert their right to equity.
Of course, equity is different from equality. Their demand would not be for equality with the top of the pyramid but reduction of inequalities.
The most disaffected section is the youth and so the government would have to contend with the sceptre of the usual disturbances.
I think the government needs to take steps to at least assure proper place for people to feel secure and happy.
And at 20 per cent we are talking about 200 million people of the country's population that makes the bottom of the pyramid.
I believe that it is the responsibility of the government, policy makers, corporations and rich people to make this 20 per cent feel secure.
Otherwise, these people would endanger your safety. History has proved it.
Has your research included samples from the area that is now referred to as the 'Red Corridor,' the area controlled by the Maoists?
In this survey we have tried to cover the majority of India's geographical area in a scientific manner.
We have covered slum areas in our sample, people who belong to the Scheduled Castes and Scheduled Tribes.
In that sense our sample data also represents the income, earnings and expenditure pattern of people in, say, the Bastar district of Chhattisgarh.
More than 20 districts of Bihar's 45 districts are also covered in this survey.


article