 | « Back to article | Print this article |
20 best nations to live in
The income distribution has worsened in most parts of the world. Latin America has the largest income inequality, although it is more equitable than sub-Saharan Africa and South Asia in life expectancy and schooling, states a UNDP report.
The report also shows that countries at the bottom of the list still suffer from inadequate incomes, limited schooling opportunities and low expectancy rates due to preventable diseases such as malaria and AIDS.
The HDI combines measures of life expectancy, literacy, school enrolment and gross domestic product (GDP) per capita. This year, the study included a record number of 187 countries and territories.
Despite, economic growth India is still ranked way below at 134. The 10 countries that place last in the 2011 HDI are all in sub-Saharan Africa: Guinea, Central African Republic, Sierra Leone, Burkina Faso, Liberia, Chad, Mozambique, Burundi, Niger, and the Democratic Republic of the Congo.
Click NEXT to find out the top 25 countries in the Human Development Index...
20 best nations to live in
1. Norway
Human Development Index: Rank 1
Life expectancy at birth (years): 81.1
Expenditure on health, public (% of GDP): 7.5
Life expectancy at birth (years): 81.1
Health index (life expectancy): 0.964
Public expenditure on education (% of GDP): 6.8
Income GNI per capita in PPP terms (constant 2005 international $): 47,557
GDP per capita in PPP terms (constant 2005 international $) 47,676
Income index (GNI per capita):0.883
Click NEXT to read more...
20 best nations to live in
2. Australia
Life expectancy at birth (years): 81.9
Health index (life expectancy): 0.976
Public expenditure on education (% of GDP) 4.5
Education index (expected and mean years of schooling): 0.981
Income GNI per capita in PPP terms (constant 2005 international $): 34,431
GDP per capita in PPP terms (constant 2005 international $): 34,259
Income index (GNI per capita): 0.837
Inequality Inequality-adjusted HDI: 0.856
Click NEXT to read more...
20 best nations to live in
3. Netherlands
Life expectancy at birth (years): 80.7
Health index (life expectancy): 0.958
Education index (expected and mean years of schooling): 0.931
Public expenditure on education (% of GDP): 5.3
GDP per capita in PPP terms (constant 2005 international $):36,358
GNI per capita in PPP terms (constant 2005 international $): 36,402
Income index (GNI per capita): 0.845
Click NEXT to read more...
20 best nations to live in
4. United States
Life expectancy at birth (years): 78.5
Expenditure on health, public (% of GDP): 7.1
Health index (life expectancy): 0.923
Public expenditure on education (% of GDP): 5.5
GNI per capita in PPP terms (constant 2005 international $): 43,017
GDP per capita in PPP terms (constant 2005 international $): 41,761
Income index (GNI per capita): 0.869
Click NEXT to read more...
20 best nations to live in
5. New Zealand
Life expectancy at birth (years): 80.7
Expenditure on health, public (% of GDP) 7.1
Life expectancy at birth (years): 80.7
Public expenditure on education (% of GDP) 6.1
Income GNI per capita in PPP terms (constant 2005 international $): 23,737
GDP per capita in PPP terms (constant 2005 international $): 24,706
Income index (GNI per capita): 0.783
Click NEXT to read more...
20 best nations to live in
6. Canada
Life expectancy at birth (years): 81.0
Health index (life expectancy): 0.962
Public expenditure on education (% of GDP): 4.9
Income GNI per capita in PPP terms (constant 2005 international $) 35,166
GDP per capita in PPP terms (constant 2005 international $): 34,567
Income index (GNI per capita): 0.840
6. Ireland
Life expectancy at birth (years): 80.6
Public expenditure on education (% of GDP) 4.9
GDP per capita in PPP terms (constant 2005 international $): 36,278
GNI per capita in PPP terms (constant 2005 international $): 29,322
Income index (GNI per capita): 0.814
Click NEXT to read more...
20 best nations to live in
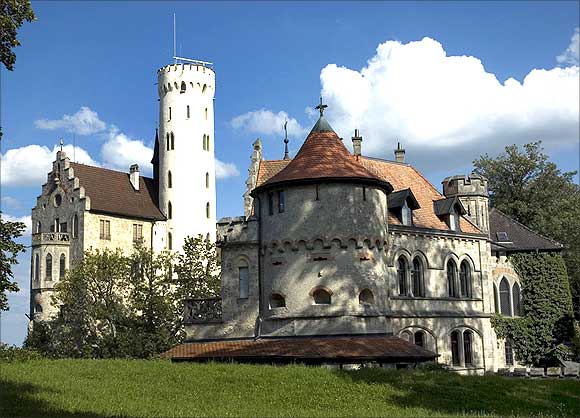
8. Liechtenstein
Life expectancy at birth (years): 79.6
Public expenditure on education (% of GDP): 2.0
Expected years of schooling (of children under 7) (years): 14.7
Education index (expected and mean years of schooling): 0.818
Combined gross enrolment in education (both sexes) (%): 86.7
Income GNI per capita in PPP terms (constant 2005 international $): 83,717
Income index (GNI per capita): 0.964
Click NEXT to read more...
20 best nations to live in
9. Germany
Life expectancy at birth (years): 80.4
Expenditure on health, public (% of GDP): 8.0
Health index (life expectancy): 0.953
Public expenditure on education (% of GDP) 4.5
Income GNI per capita in PPP terms (constant 2005 international $): 34,854
GDP per capita in PPP terms (constant 2005 international $): 32,255
Income index (GNI per capita): 0.838
Click NEXT to read more...
20 best nations to live in
10. Sweden
Life expectancy at birth (years): 81.4
Expenditure on health, public (% of GDP): 7.4
Health index (life expectancy): 0.969
Public expenditure on education (% of GDP): 6.6
Income GNI per capita in PPP terms (constant 2005 international $): 35,837
GDP per capita in PPP terms (constant 2005 international $): 32,314
Income index (GNI per capita): 0.842
Click NEXT to read more...
20 best nations to live in
11. Switzerland
Life expectancy at birth (years): 82.3
Health index (life expectancy): 0.983
Public expenditure on education (% of GDP): 5.2
Income GNI per capita in PPP terms (constant 2005 international $): 39,924
GDP per capita in PPP terms (constant 2005 international $): 36,954
Income index (GNI per capita): 0.858
Click NEXT to read more...
20 best nations to live in
12. Japan
Life expectancy at birth (years): 83.4
Expenditure on health, public (% of GDP): 6.5
Health index (life expectancy): 1.000
Income GNI per capita in PPP terms (constant 2005 international $): 32,295
GDP per capita in PPP terms (constant 2005 international $): 29,692
Income index (GNI per capita): 0.827
Click NEXT to read more...
20 best nations to live in
13. Hong Kong, China (SAR)
Life expectancy at birth (years): 82.8
Health index (life expectancy): 0.990
Public expenditure on education (% of GDP) 4.5
Income GNI per capita in PPP terms (constant 2005 international $): 44,805
GDP per capita in PPP terms (constant 2005 international $): 39,255
Income index (GNI per capita): 0.874
Click NEXT to read more...
20 best nations to live in
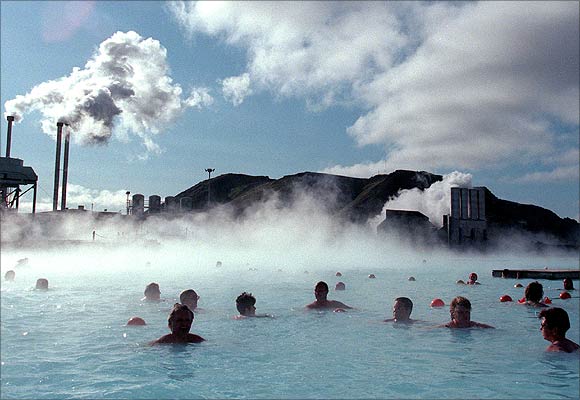
14. Iceland
Life expectancy at birth (years): 81.8
Expenditure on health, public (% of GDP): 7.7
Health index (life expectancy): 0.975
Public expenditure on education (% of GDP): 7.4
Income GNI per capita in PPP terms (constant 2005 international $): 29,354
GDP per capita in PPP terms (constant 2005 international $): 33,980
Income index (GNI per capita): 0.814
Click NEXT to read more...
20 best nations to live in
15. Republic of Korea
Life expectancy at birth (years): 80.6
Expenditure on health, public (% of GDP): 3.5
Health index (life expectancy): 0.956
Income GNI per capita in PPP terms (constant 2005 international $): 28,230
GDP per capita in PPP terms (constant 2005 international $): 25,493
Income index (GNI per capita): 0.808
Click NEXT to read more...
20 best nations to live in
16. Denmark
Life expectancy at birth (years): 78.8
Expenditure on health, public (% of GDP): 8.2
Health index (life expectancy): 0.928
Income GNI per capita in PPP terms (constant 2005 international $) 34,347
GDP per capita in PPP terms (constant 2005 international $): 32,252
Income index (GNI per capita): 0.836
Click NEXT to read more...
20 best nations to live in
17. Israel
Life expectancy at birth (years): 81.6
Expenditure on health, public (% of GDP): 4.5
Under-five mortality rate (per 1,000 live births): 4
Health index (life expectancy): 0.972
Income GNI per capita in PPP terms (constant 2005 international $): 25,849
Click NEXT to read more...
20 best nations to live in
18. Belgium
Life expectancy at birth (years): 80.0
Expenditure on health, public (% of GDP): 7.0
Under-five mortality rate (per 1,000 live births): 5
Health index (life expectancy): 0.947
GDP per capita in PPP terms (constant 2005 international $) 32,395
GNI per capita in PPP terms (constant 2005 international $) 33,357
Income index (GNI per capita): 0.832
Click NEXT to read more...
20 best nations to live in
19. Austria
Life expectancy at birth (years): 81.9
Health index (life expectancy): 0.976
Public expenditure on education (% of GDP) 4.5
Education index (expected and mean years of schooling): 0.981
Income GNI per capita in PPP terms (constant 2005 international $): 34,431
GDP per capita in PPP terms (constant 2005 international $): 34,259
Income index (GNI per capita): 0.837
Click NEXT to read more...
20 best nations to live in
20. France
Life expectancy at birth (years): 81.5
Health index (life expectancy): 0.971
Education index (expected and mean years of schooling): 0.870
Public expenditure on education (% of GDP) 5.6
Education index (expected and mean years of schooling): 0.870
Combined gross enrolment in education (both sexes) (%) 94.5
Income GNI per capita in PPP terms (constant 2005 international $) 30,462
GDP per capita in PPP terms (constant 2005 international $)29,578
Income index (GNI per capita):$0.819


