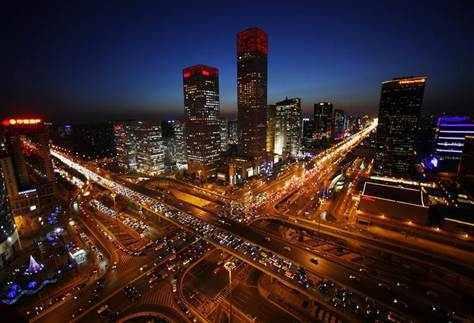
International commercial property markets have reacted to the increased uncertainty in the global economy in late 2011 and early 2012 with varying degrees of resilience.
Demand for office space has remained robust in many markets in the US, Germany and mainland China, but reduced occupier confidence and falling rents have been witnessed in a number of major Asian financial centres and in the European markets most affected by the debt crisis, according to a outlook study conducted by Knight Frank, an international property consultancy.
Here, we present you cities which are known for its steep commercial real estate prices. This list also includes India's two leading cities.
Click NEXT to read more...
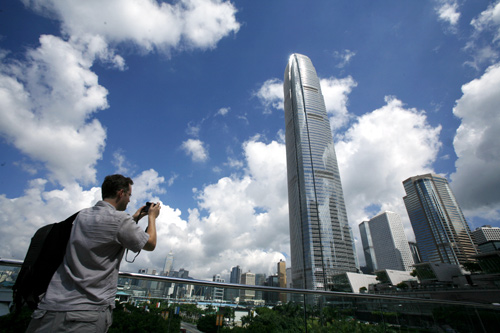
Hong Kong
Rent (US$/sq ft/yr): 150.09
2010 Ranking: 3
2011 Ranking: 1
Following two years of exceptional growth, prime office rents peaked in the Central district of Hong Kong in the second half of 2011, and rental falls were recorded in the final four months of the year.
Click NEXT to read more...
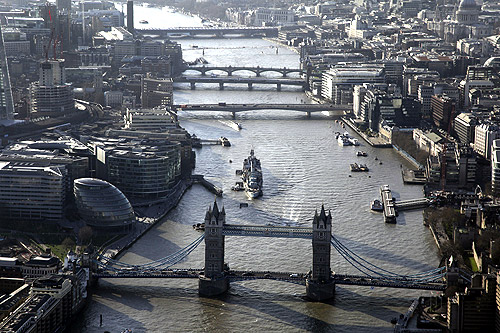
London (West End), UK
Rent (US$/sq ft/yr): 142.94
2010 Ranking: 1
2011 Ranking: 2
For,
London (City)
Rent (US$/sq ft/yr): 84.99
2010 Ranking: 7
2011 Ranking: 8
London offices saw an influx of cross-border capital, particularly from Asia, with major transactions involving buyers from countries including Malaysia, Singapore, Hong Kong, South Africa and the US.
Click NEXT to read more...
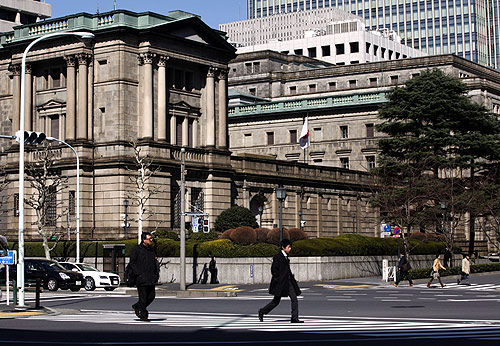
Tokyo, Japan
Rent (US$/sq ft/yr): 118.89
2010 Ranking: 2
2011 Ranking: 3
Prime office rents in Tokyo remain under moderate downward pressure, with landlords needing to offer competitive rents in order to attract cost-conscious tenants. But, the vacancy rates may edge further upwards with a significant number of projects due for completion in 2012.
Click NEXT to read more...
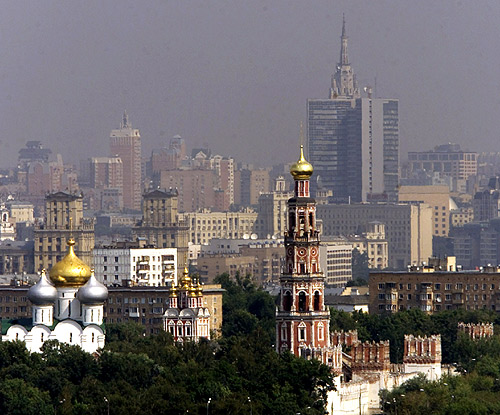
Moscow, Russia
Rent (US$/sq ft/yr): 111.48
2010 Ranking: 4
2011 Ranking: 4
Take-up of Class A and B office space in Moscow was 989,000 sq m in 2011, almost exactly the same level as 2010, but still some way short of the totals recorded in the boom years of 2006-08.
Click NEXT to read more...

Paris, France
Rent (US$/sq ft/yr): 99.84
2010 Ranking: 5
2011 Ranking: 5
Paris office market amounted to just over 2.4 million sq m in 2011, 13 per cent up on 2010, with the improvement primarily driven by a number of very large leasing transactions of over 20,000 sq m.
Click NEXT to read more...
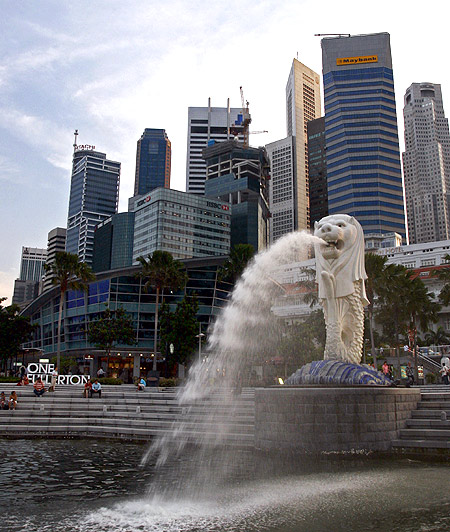
Singapore
Rent (US$/sq ft/yr): 87.65
2010 Ranking: 6
2011 Ranking: 6
The outlook for Singapore's trade-based economy has worsened, with government forecasts suggesting that GDP growth will slow from 4.8 per cent in 2011 to no more than 3 per cent in 2012.
This is expected to cause office occupiers to rein in their expansion plans and office market activity is likely to weaken in the next year. Prime office rents began to fall in the final quarter of 2011, and are forecast to decrease by up to 15 per cent over the course of 2012.
Click NEXT to read more...
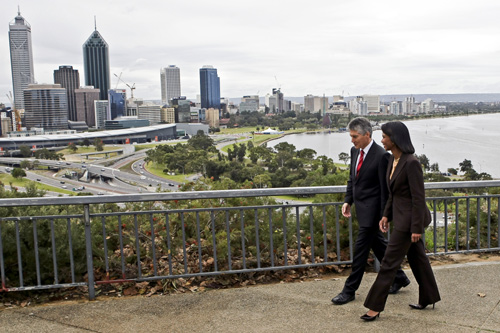
Perth, Australia
Rent (US$/sq ft/yr): 86.49
2010 Ranking: N/A
2011 Ranking: 7
Perth now has the highest prime office rents in Australia, albeit Sydney still achieves the highest individual rents in trophy, premium buildings.
Office rents in Perth are expected to rise further in 2012, with demand supported by the strength of Western Australia's economy, which is currently outperforming the rest of the nation.
Click NEXT to read more...
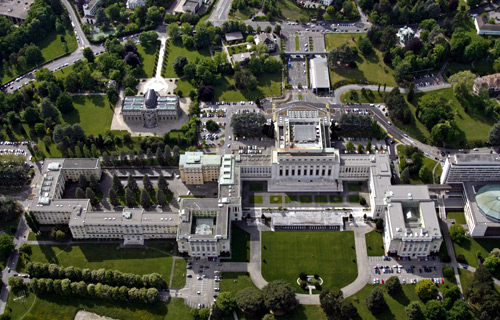
Geneva, Switzerland
Rent (US$/sq ft/yr): 84.01
2010 Ranking: 11
2011 Ranking: 9
Office vacancy rates increased in the past two years as jobs were lost, but are expected to improve soon.
Click NEXT to read more...

Sydney, Australia
Rent (US$/sq ft/yr): 82.61
2010 Ranking: 8
2011 Ranking: 10
Demand for office space in Sydney remains relatively patchy, although prime accommodation has been surprisingly resilient in the face of reduced business confidence caused by the uncertainty in the global economy.
The vacancy rate stood at 9.6 per cent at the year-end, an increase from 8.3 per cent at the start of 2011 caused primarily by the completion of several large new developments in the first half of the year.
Click NEXT to read more...
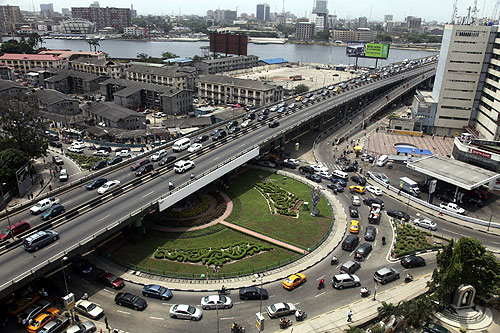
Lagos, Nigeria
Rent (US$/sq ft/yr): 78.04
2010 Ranking: 10
2011 Ranking: 11
Luanda, Angola, and Lagos, Nigeria, are among the most expensive cities in the world in which to rent offices, with both markets having a very limited supply of high quality space able to meet the requirements of international occupiers, particularly those from the oil and gas industries.
Lagos continues to be severely affected by overcrowding and poor infrastructure, but several very large projects aimed at improving the city's built environment are in the pipeline, including Eko Atlantic City and the Lekki Free Trade Zone.
Click NEXT to read more...

St Petersburg, Russia
Rent (US$/sq ft/yr): 71.53
2010 Ranking: 17
2011 Ranking: 12
St Petersburg also recorded rising office rents and falling vacancy rates. The most significant recent development in the market has been the growth of the Pulkovo business district, south of the city and near the airport.
Click NEXT to read more...
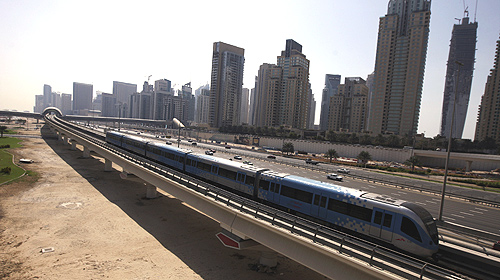
Dubai, UAE
Rent (US$/sq ft/yr): 68.10
2010 Ranking: 12
2011 Ranking: 13
In Dubai, the office occupier market has struggled for a number of years, although an increase in activity was recorded in late 2011 and early 2012, in part due to the Arab Spring.
Dubai's "safe haven" status in the Gulf has led to a number of companies expanding and consolidating their operations in the Emirate.
Click NEXT to read more...

Mumbai, India
Rent (US$/sq ft/yr): 67.79
2010 Ranking: 9
2011 Ranking: 14
The Mumbai office market was relatively subdued in 2011, with occupiers from the business, financial and insurance sector, traditionally the major drivers of the market, accounting for a reduced share of leasing activity compared with recent years.
High vacancy rates and a large development pipeline are likely to keep rental levels in Mumbai under downward pressure in 2012.
Click NEXT to read more...
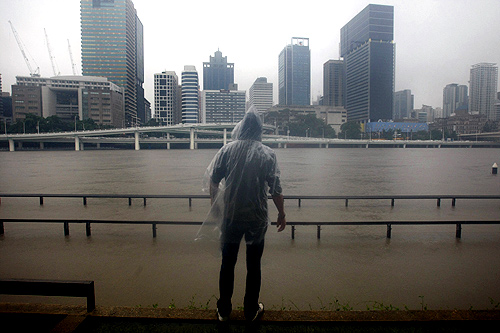
Brisbane, Australia
Rent (US$/sq ft/yr): 64.75
2010 Ranking: 14
2011 Ranking: 15
In Brisbane, the vacancy rate fell steadily in 2011, to reach 6.2 per cent at the year-end, and rents rose modestly. However, an ample development pipeline may dampen the rate of rental growth in Brisbane during 2012.
Click NEXT to read more...
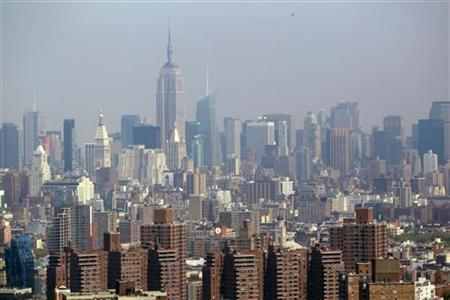
Manhattan, USA
Rent (US$/sq ft/yr): 64.36
2010 Ranking: 22
2011 Ranking: 16
As one of the stronger performing US office markets, conditions in Manhattan showed signs of improvement in 2011. The average asking rent rose by the end of 2011 to $66.48 per sq ft from $61.44 per sq ft, an 8.2 per cent increase year over year.
Click NEXT to read more...

Milan, Italy
Rent (US$/sq ft/yr): 63.15
2010 Ranking: 16
2011 Ranking: 17
Despite the negative news surrounding the Italian economy, there were robust levels of leasing activity in Milan in 2011.
Nonetheless, availability has increased, particularly in peripheral areas, as occupier interest has been focused on prime central space at the expense of lower quality offices in secondary locations.
Click NEXT to read more...
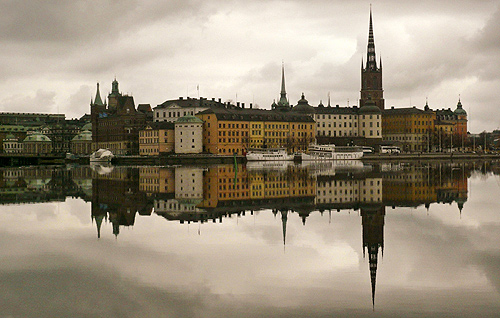
Stockholm, Sweden
Rent (US$/sq ft/yr): 60.62
2010 Ranking: 20
2011 Ranking: 18
Stockholm and Oslo recorded some of the strongest prime office rental growth anywhere in Europe in 2011. Commercial property investment in Sweden amounted to ��.1 billion, up by 20 per cent on 2010, making it the fourth most active country in Europe, behind the "big three" markets of the UK, Germany and France.
Click NEXT to read more...
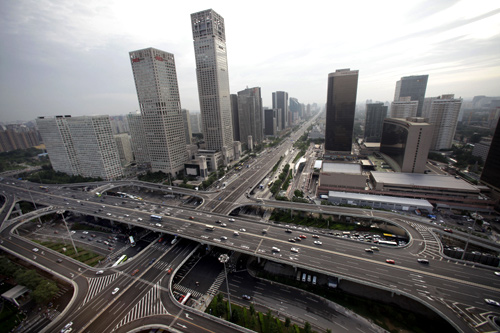
Beijing, China
Rent (US$/sq ft/yr): 56.05
2010 Ranking: 48
2011 Ranking: 19
Beijing market recorded exceptionally strong rental growth in 2011, with prime rents rising by 46 per cent. Beijing and Shanghai are both forecast to see continued rental growth in 2012.
Click NEXT to read more...

Delhi NCR, India
Rent (US$/sq ft/yr): 55.03
2010 Ranking: 15
2011 Ranking: 20
The National Capital Region (NCR) experienced a similar 57 per cent plunge, compared to the same quarter a year ago, according to realty research firm PropEquity.
Click NEXT to read more...

Melbourne, Australia
Rent (US$/sq ft/yr): 54.44
Ranking 2010: 23
Ranking: 21
In Melbourne, the office vacancy rate fell from 6.6 per cent to 5.3 per cent during 2011, although the rate at which availability fell slowed during H2 as leasing activity softened.