How is RoE calculated?
RoE is calculated by dividing the 'profit after tax' earned in an accounting year with the 'equity capital' as mentioned in the balance sheet of the company. Let us take the example of Infosys. The company earned a profit after tax of Rs 59,880 m in FY09. Also, its average equity capital for FY09 was Rs 182,540 m. Thus, Infosys' RoE in FY09 was 32.8% i.e. Rs 59,880 m divided by Rs 182,540 m.

Thus, RoE, when used correctly, can easily measure the management's capability on the three fronts -
1) Profitability (PAT/Sales),
2) Asset turnover (Sales/Assets), and
3) Financial leverage (Assets/Equity)
What we are trying to say here will be made simpler when we break down the calculation of RoE into these three parts. As such, RoE can also be calculated as -
Return on Equity = (PAT/Sales) * (Sales/Assets) * (Assets/Equity)
OR
Return on Equity = Profit margin * Asset turnover * Leverage
Let's take Infosys as an example and begin with the 'profitability' part.
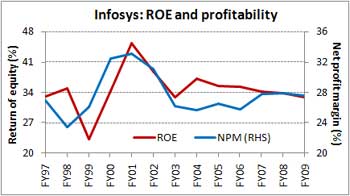
RoE and Profit margins
Profit margins are, most importantly, a measure of the company's pricing power. Consequently, pricing power is a function of
Now, apart from this fall in billing rates, another factor that has impacted the company's margins is its aggressive investments in building up physical (infrastructure) and human (manpower) resource base. While we believe that the scale benefits from these investments are likely to pay in the future, the fact that the company will have to consistently spend towards employees and marketing initiatives. This will affect margins further, though at a slower rate. And this will affect the company's RoE, as it has been the case in the past.

RoE and Asset turnover
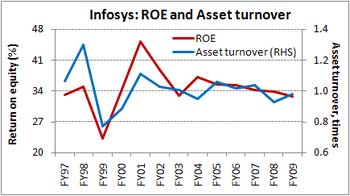
Infosys has one of the highest margins in the Indian software services sector. But, is that enough? Not really. Although margins play a crucial role in influencing the RoE of a company, the sales generated for each rupee of assets also plays a very important role. In the case of Infosys, while decline in margins have affected RoE, the fact that the company has been earning a higher amount for every rupee invested in its fixed assets, has helped it to pare decline in the same (the RoE).
However, this does not compare well with its peers. For instance, in FY09, while Infosys earned Rs 0.98 for each rupee invested in its assets, TCS earned Rs 1.23. Historically, Infosys has had lower asset turnover as compared to its peers. This is mostly due to the company's aggressive capex levels.

Generating more sales on less assets means tying up of less capital that a business generates on its assets. As such, determining the asset management capability of a company is the key to gauging the quality of its RoE.
RoE and leverage
Leverage (the other name for debt) is a tool finance managers can use to perk up a company's RoE in the short term. They can simply take on more of debt than equity to finance their expansion plans. And wow, what investors see is an improved RoE (since debt is deducted from assets to calculate the value of equity)! However, over the long-term, the fact that the company has to pay interest on this debt, reduces its profit margins. This acts as a counter to the rise in RoE due to increased debt levels (if the debt is not productively employed).
Thus, investors need to study debt levels of a company, as this would make their understanding of RoE even simpler. In this case, since Infosys has no debt on its books, its RoE tracks the leverage. However, in case of companies with high levels of debt (those in capital intensive industries like steel and automobiles), the leverage ratio will play a very important role in understanding the RoE.
It may be noted that TCS's RoE for FY09 stood at 33.5%. While the company has poorer margins as compared to Infosys, the fact that it has a higher leverage ratio (1.44) as compared to Infosys has driven up its RoE.

While RoE is important, it is not everything
RoE suffers from one drawback. As mentioned earlier, a company that takes high levels of debt will show up a high return on equity. As such, 'Return on Invested Capital' and not RoE will be a good indicator of testing the company's efficiency levels. However, for understanding the value of companies with nil or marginal amounts of debt, RoE is of great help. We shall explain this with an example:
Company 'A' is a debt-free company with a networth of Rs 100 m. During FY09 it earned a net profit of Rs 15 m. As such, its RoE would stand at 15% for the year. Now, in another case, company 'B' has a net worth of Rs 50 and a debt to equity ratio of 1:1. This means it would have taken up debt to the tune of Rs 50 m. Capital employed in the business is the same amount as of company 'A' - Rs 100 m.
Now, as the company has taken up some debt, it would have to pay a certain amount of interest on the debt. For instance, the interest rate on the debt is 10% for the year. As such, the interest cost for the company will be Rs 5 m (10% * Rs 50 m) for the year. The net profit for the year will stand at Rs 10 m (Rs 15 m Rs 5 m). Now, if we calculate RoE on this basis, it would stand at a high rate of 20% (Rs 10 m / Rs 50 m). This does show the wrong picture.
As such, it helps investors to look at trends in RoE over a number of years and analyse each of its components (as mentioned above). It will not only help them understand the P&L account, but also to balance this against the much overlooked left and right sides of the balance sheet.


