What could be the reason for the successive downward revisions across the board? Some key indicators make it evident, reports Abhishek Waghmare.
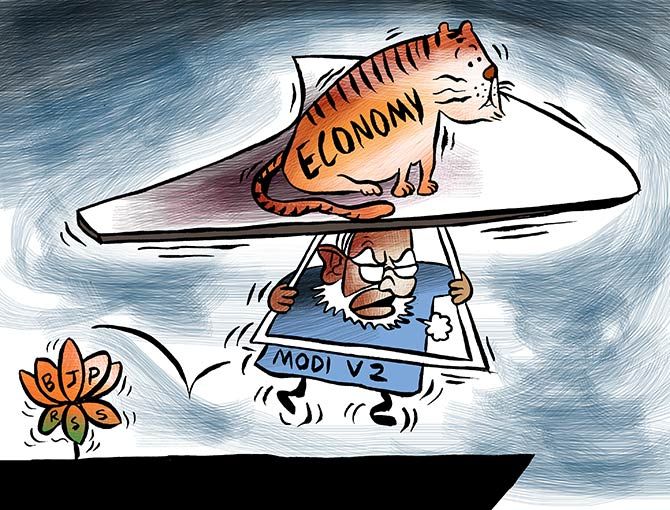
Illustration: Uttam Ghosh/Rediff.com

Economy observers are finally spelling out the gravity of the slowdown India finds itself in.
Before the financial year began, the Reserve Bank of India thought the Indian economy would grow at 7.4 per cent in FY20.
Over eight months, it gradually revised its estimate downward to 6.1 per cent.
Last week, the State Bank of India projected FY20 growth at 5 per cent, and a top Delhi-based think tank expects the economy to grow at 4.9 per cent.
What could be the reason for these successive downward revisions across the board? Some key indicators make it evident.
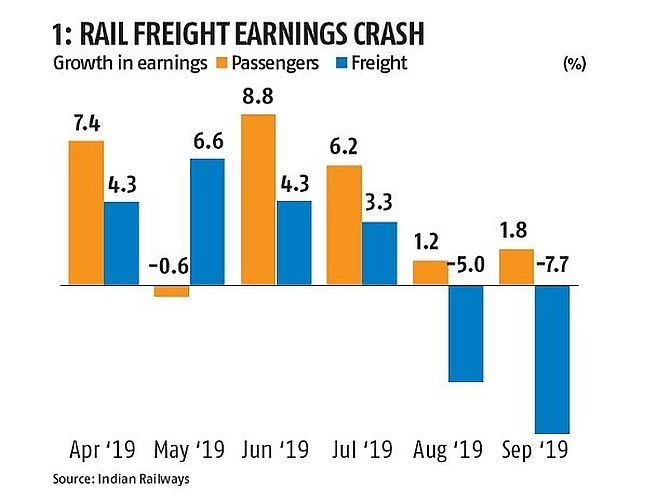
Earnings from rail freight are gradually reducing and contracted by 7.7 per cent in September 2019 (chart 1).

This indicates declining industrial demand.
Air travel did pick up in FY20, but is now looking down, showing slackening demand (chart 2).

While petrol consumption seems on track, diesel consumption has tanked, reaffirming industrial slowdown (chart 3).

The index of industrial production (IIP) shows the areas of stress in the economy (chart 4).

Even pharma has come under pressure.
Core inflation is a measure of inflation without volatile components like food and fuel.
It represents business demand and pricing power of companies.
While it was driving overall inflation up until recently (strong demand), it has now fallen below the level of overall inflation (weak demand) (chart 5).

On the external front, while exports remain poor, imports are increasingly falling in FY20, showing deepening economic stress (chart 6).


 © 2025