Signs abound of money flowing out of commodities and equities into US treasuries, indicating we are nearing a top even in the US markets, says Sonali Ranade
Just as one thought, a much-awaited correction in the markets was at hand, the Bank of Japan unleashed a massive $1.14 trillion stimulus package designed to clobber the yen into reviving the Japanese economy. Despite that, barring a day or two of turmoil in the currencies, the markets took the whole thing in their stride. Or may be central bankers have taken to reading the charts and timing their moves. At least in the case of BoJ, that appeared to be so. Astute!
National equity markets are out of sync, each going its own way. Nikkei perked up in response to the package, Shanghai continued its correction, as did India. DAX is leading the EU equity markets into an intermediate correction, while the US, as the strongest economy to emerge from the 2007 crisis, continues to advance.
Nevertheless, signs abound of money flowing out of commodities and equities into US treasuries, indicating we are nearing a top even in the US markets. Commodity prices are compressing even in things like crude, which has been a prominent holdout so far. Crude could tank to levels not seen since 2003 but it is too early for that prognosis.
Compressing commodity prices might help world GDP to recover later in the year, helping build a base for the next rally and cutting down the deflationary surpluses that have been building in the OPEC countries. High oil prices, in a sense, are nothing but a tax on oil consumers beyond a point.
Indian equity markets continue to correct. My sense: we are approaching the end of a very complex cycle of correction that began with the crash of 2007. We might see the correction terminate on the support line that runs up with the Nifty from 2003 onwards, which in my view would be in the fitness of things. That means this correction ends near about 5400.
Happy trading!
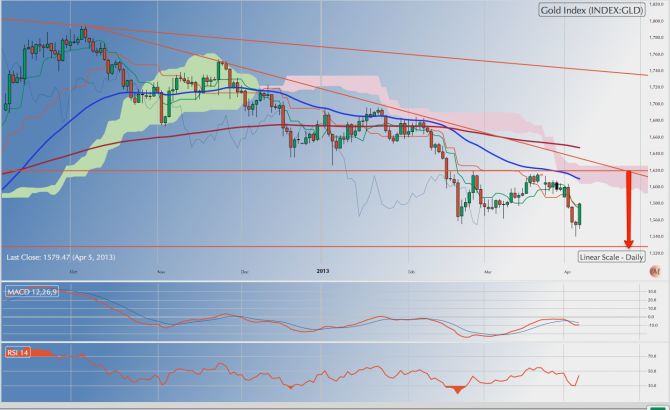
Gold: The yellow metal made a low of 1539.40 during the week before pulling back sharply to 1581.80 on Friday. It closed the week at 1575.90.
While the pullback from 1539.40 was sharp, and the low made was fairly close to the target of 1525, my sense is that both in terms of price and time, we have not yet seen a bottom to gold. We can expect at least one more attempt, if not more, to retest 1525 in over the next few weeks or so. My first target for the gold on the downside remains 1525.
A pullback above $1620 would negate this analysis and indicate that a bottom has been made at $1539.40.
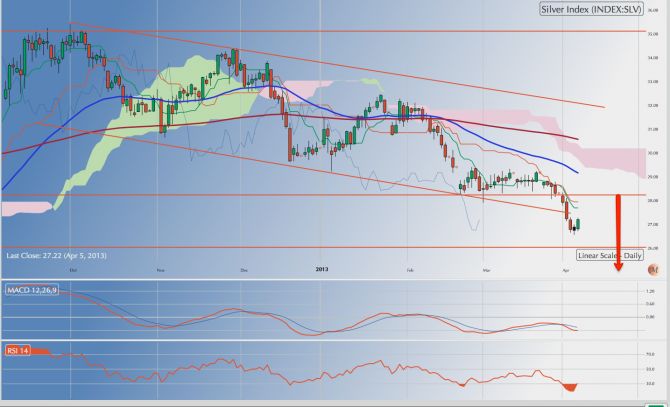
Silver: Silver made a low of 26.575 during the week before pulling up modestly to close the week at 27.22.
Like gold, the correction in silver is by no means over, both in terms of price and time. Silver can see a pullback to $28 before it makes another attempt to take out $26. Important supports are usually taken out in the third or fourth attempt. I am not sanguine that the $26 floor for silver will hold.
A sustained rally above $28 will negate the above analysis.
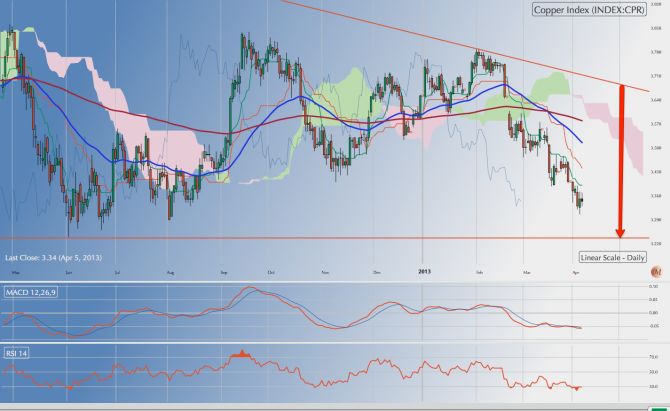
HG Copper: It closed the week at 3.344 after making a low of 3.3515 during the week. On the oscillator charts, copper is clearly oversold and the oscillators have hit a bottom consistently at about current levels. A pullback in copper is about due.
However, there is time for copper to retest 3.25, which appears to be its target for this correction. There doesnt appear to be substantial downside to copper from the current levels even though a bottom may not be in place. Coppers 200 DMA is currently at 3.50 as is its 50 DMA.
Shorts in the metal should take their profits. Wait to go long until there is a clear reversal.
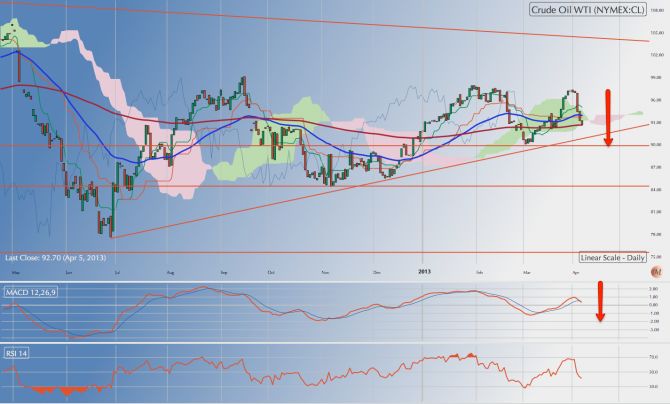
WTI Crude: It closed the week 92.70, below its 50 DMA currently placed 94.75 but above its 200 DMA currently at 91.15. Crude has first support at 89.50, which is also the base trend line for this rally.
My sense is that the pullback from the low of 77 in July 2012 to 98/99 level in crude have been reactive in nature and crude is now headed down towards a retest of 77. It may not get there. First target for this correction is 89 followed by 84.
A rally above 95 in crude will negate this analysis. Incidentally, crude has been the odd-man-out in the current commodity correction. That might be about to change.
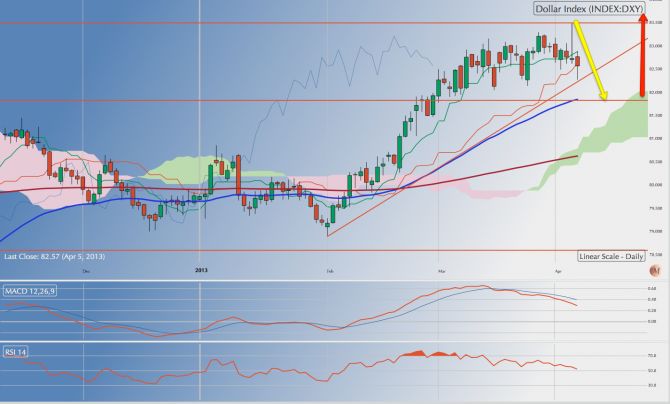
US Dollar [DXY]: Currency markets were thrown in turmoil by the $1.14 trillion stimulus package announced by the Bank of Japan during the week. Yet the resilience of the trends underway was such that the news was absorbed without a basic change in direction of the markets in any major currency.
DXY closed the week at 82.603 after making a high of 83.66, a new high for the current rally. DXY could move sideways for a week or two consolidating above 81.50. Maintain my view that DXY is an intermediate uptrend that will test its recent high of 84.25 and possibly reach higher.
A fall below the 200 DMA, currently at 81 will negate this analysis.
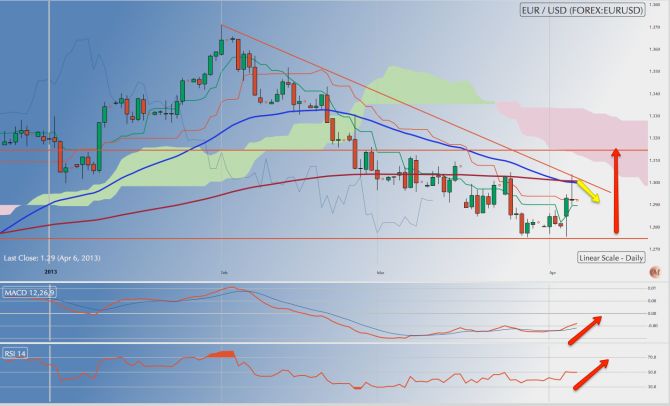
EURUSD: It closed the week at 1.2989 after making a low of 1.2745 during the week. With that, the first leg of the correction in the euro from its recent top of 1.37 may have been completed and we could see a period of consolidation in the euro between 1.27 and 1.32.
Expect the EURUSD to pullback from 1.30 to retest the new floor at 1.27 before drifting back up to 1.32. The pullback is just B wave of a correction down from 1.37 and therefore will be choppy.
A violation of the floor at 1.27 will negate this analysis.
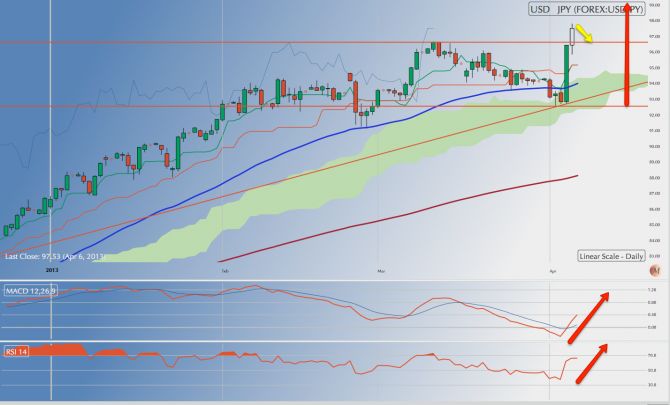
USDJPY: It closed the week at 97.52 after making a low of 92.52 during the week. A modest pullback from 98 levels in the pair can be expected next week but the target for this rally appears to be 102. Note, we are now in the 28th month of this rally from a low of 75.50 to 97.50. There are a few more weeks to this rally but an intermediate correction approaches. Using the yen as the carry currency is fraught with risk until we have seen a substantial correction in the pair.
A drop below 90 in the pair would warrant a fresh look into the charts. Tread with caution. The BoJ move appears to have been timed to extend the rally and the extension will depend on heavy intervention.
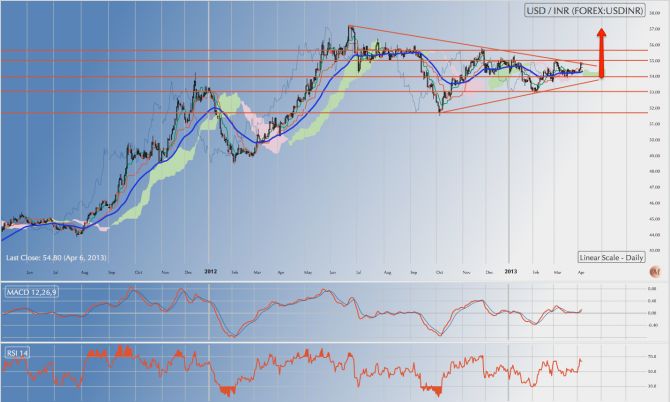
INRUSD: This week I have used the INR/USD chart instead of the usual USDINR chart to illustrate an interesting divergence. For perspective, the USDINR is also given above.
The INR/USD chart shows that the rupee was worth $0.023 in July 2011 and has since depreciated to $0.018. The lower tops from July 2011 to date make the depreciating trend of the INR clear.
The INR made a low of $0.017 approx [or, a $ was worth INR 58.82] in June 2012, [when we say the $ topped out at INR 57.25 in Indian markets], and has since been correcting upwards. The pullback made lower tops consistently but the bottoms were not new lows as often happens in the terminal part of correction. It is as if the INR was building up pressure to take out $0.17 level again.
Reverting to the usual USD/INR chart, the $ closed the week at INR 54.79, well above its 50 and 200 DMA. The $ could pull back to its 200 DMA at 54.50 early next week and then head testing 55.50 which is a major overhead resistance. My sense is that the USD/INR pair will eventually retest 57.25.
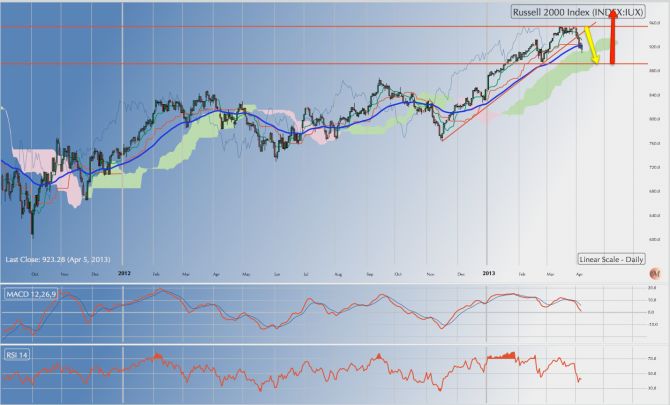
Russell 2000 [RUT]: Russell 2000 [RUT], which represents the mid-cap space in the US equity markets, was the earliest to make an all time new high well above its 2007 peak of 854. It made 954 on March 15, 2013, and has been correcting since. It closed the week at 932.28. The question is: Has the index topped out in terms of price, wave counts and time?
Taking this rally from the level of 600 in October 2012, it is clear that we are pretty much close to the end but not quite there. In terms of price, unless the level of 850 is clearly violated, there is no signal for a trend reversal. And from current levels first support is 894.
Taking the rally from 776 on November 16, the index was due to correct by the end of February and has done so from March 14. The current correction can carry on for a week or more and safely extend to 895 without triggering any technical damage. So all told, it is premature to call an end to the rally although as noted, we are at just about the last stage of this bull market.
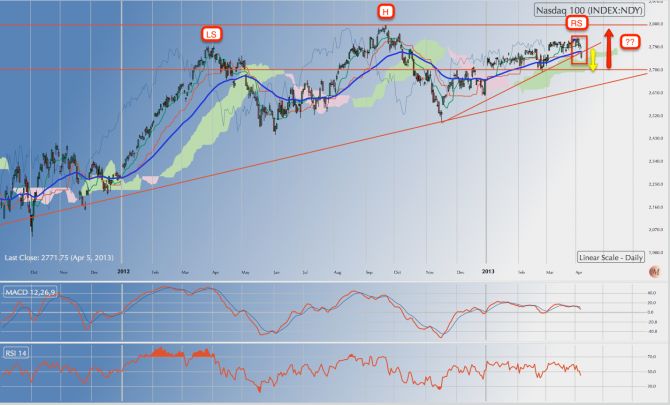
Nasdaq 100: The Nasdaq 100 [N100] closed the week at 2771.75 after making a high of 2808.72 during the week. The indexs monstrous inverted S-H-S looms large over the market but is nowhere near confirmation. And as long as it doesnt confirm, it doesnt count, only cautions.
That said, N100 is the weakest index in the US equity markets and so its worth concentrating on this index for the earliest sign of a breakdown or reversal. The indexs 200 DMA is currently at 2700. It has already made a lower top at 2808 compared with the one at 2861. It has violated its 50 DMA, which is currently at 2780. And the indexs first major support also lies at 2700, pretty much on its 200 DMA.
Clearly a violation of 2700 triggers a reversal signal that cant be ignored. On the other hand, a bounce from 2700 will have to take out 2832 in order not to trigger a reversal signal. Hence Nasdaq 100 is probably the best index to watch for confirmation of a reversal. Note, one hasnt been triggered yet.
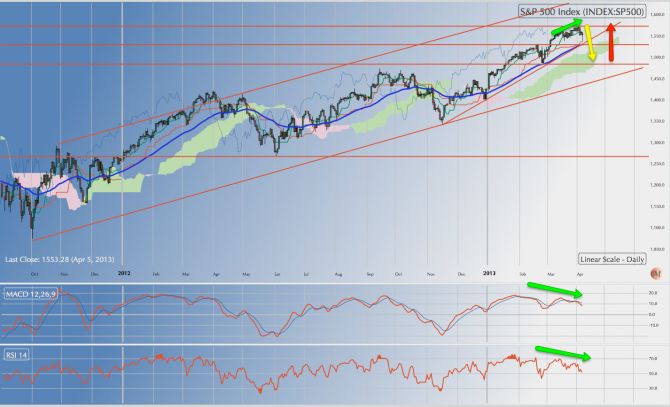
SPX: The SPX closed the week at 1553.28 after making a new high of 1570.25. The SPX is the strongest of the major US equity indices and apart from the divergences noted in green arrows on the charts, shows no sign of exhaustion.
First support lies at 1530, followed by a more solid support at 1485. Until 1485 is taken out, there is no danger to the continuation of the rally. Indeed, the index could continue correcting for three-fourth of a week and test 1485 without ending the bull market. In terms of time, there is scope for a lot of surprises to the upside in this index.
Until 1485 gets taken out in this correction, dont short the market.
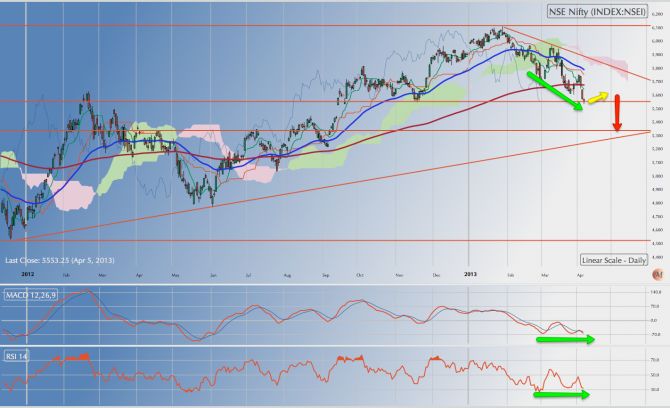
NSE NIFTY: The Nifty closed the week at 5553.25, well below its 200 DMA after making a high of 5754. The correction from the recent top of 6100 continues. There are some divergences on the oscillator charts to show we may be nearing a bottom but no sign of reversal yet. These are marked in green arrows above.
Clearly the correction is going to test the support line of the markets that has held up in every correction since 2003. Very hard to see the market violating this support line apart from passing nick over a few days. Indications are that the market will test this support line around 5400 on the Nifty. On the charts, Nifty has strong support spanning from 5400 to 5300. My sense is that we may expect an end to the current correction around those levels.
I would look to buy blue chips that were close to their lows and have stopped making new lows even as the market continues to correct.
NB: These notes are just personal musings on the world market trends as a sort of reminder to me on what I thought of them at a particular point in time. They are not predictions and none should rely on them for any investment decisions.
Sonali Ranade is a trader in the international markets


 © 2025