Temper greed with plenty of caution, warns Sonali Ranade
We are in a very mature bull market that has been running up from March 2008 for nearly four years. As such, one may expect a fairly deep and serious correction to set in at any time. However, market structure, wave counts and timing of certain moves enable us to spot a crack in the markets well before it happens. So this exercise is mainly to see if any such cracks that presage the onset of a correction are obvious.
On the other hand, markets usually go parabolic before a correction and a significant percentage of the gains come from such euphoric moves. So the possibility of a terminal parabolic move in the markets is difficult to ignore. With these caveats in mind, read on. Temper greed with plenty of caution!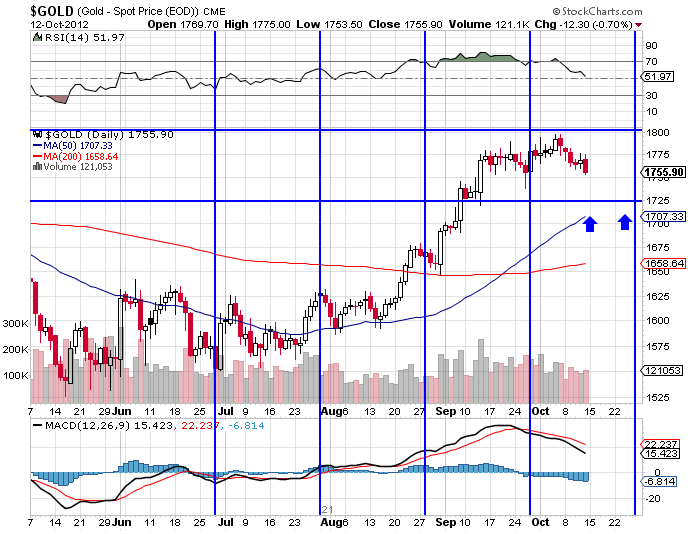 Gold [$GOLD]: As expected, gold continued to correct from its recent top of $1777.50 and closed the week at $1753.50, a touch above the indicated support at $1750.
The correction in gold looks set to continue. Its first support from current levels lies at $1740 followed by a more robust support at $1700. Gold's 50 DMA lies in the $1700 region and its 200 DMA at $1650. As indicated before, gold could continue to consolidate broadly between $1800 and $1700 levels from here to end of December before making a decisive move one way or the other.
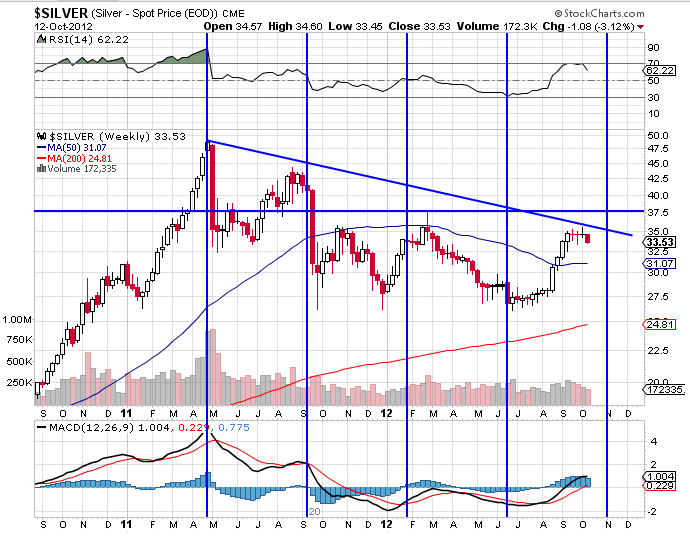 Silver [$SILVER]: Silver too continued to correct from its recent top at $35.50 to close the week at $33.95. Silver's first support from current levels lies at $32.50.
Silver is likely to continue to consolidate above $32.50 but below $36 for a few weeks more before making a final attempt at a rally to $37.50 or higher. Silver's rally from the recent bottom of $26 is in the nature of a corrective rally whose ultimate target is probably in the $37.50 region. In terms of time, this rally could reach its target March next year.
That said, there is nothing bullish about the metal in the long term so far. You would need to rethink if it breaks well above $38. Until then I remain bearish on the metal.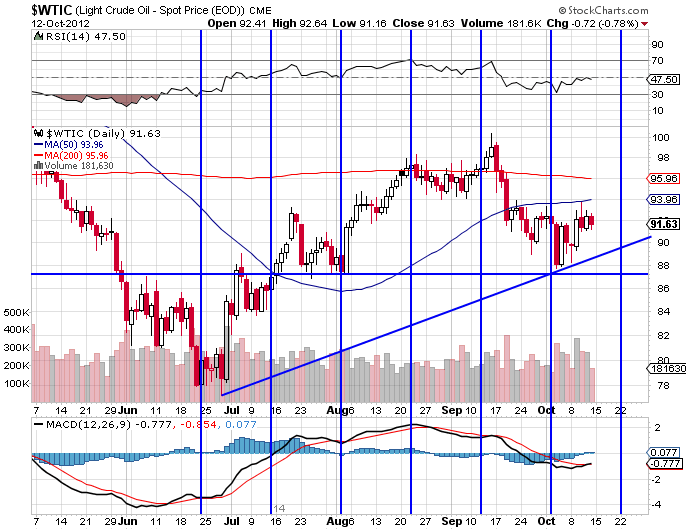 Crude Oil [$WTIC]: WTI crude continued to correct from its recent top of $110 and closed the week at $91.86. Its first support from current level lies at $87 followed by deeper support at $78.
Crude's price action so far is constructive and consistent with the notion of a bullish cup and handle correction to its rise from $32 to $115. On such reckoning, the correction could last till the second week of November and end in the vicinity of $80.
However, over the long term, there is nothing bearish in crude's chart despite the fact the correction turned out to be much deeper than expected. I would not be surprised if crude turns around much before $80 although it is bound towards that area on the charts.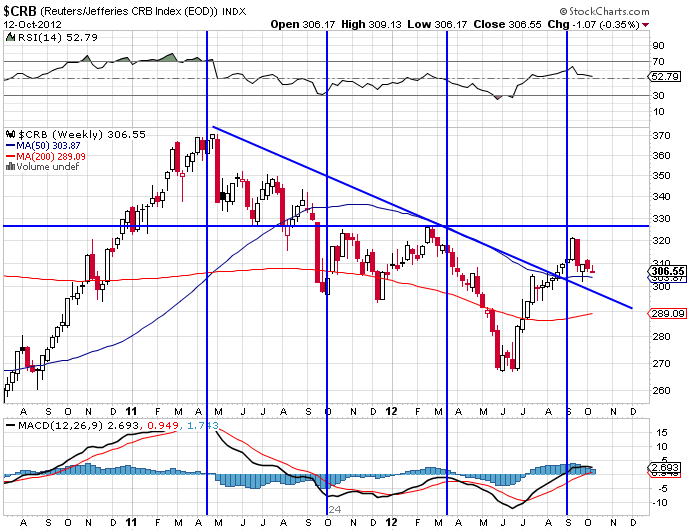 Reuters CRB Index [$CRB]: Reuters CRB Index is a goof proxy for commodities in general. The Index has been correcting from its top of 370 and is now positioned at 306.55, having made a recent low of 268, which probably was the bottom. The current correction from 320 levels will possibly test the index's 200 DMA in the 290 region.
From current level the index's first major support is at the 290 region followed by a deeper support at 268. Needless to say, a successful retest of the 290 region (ie, a rebound from there) would be very bullish for the commodity markets and signal an end to the current correction.
 Dollar [$USD]: Dollar has been correcting down from its recent high of 84.25 and closed last week at 79.74 after its recent low at 78.62. The corrective bounce could test the 200 DMA currently placed at 80.50. However, the more likely course is a retest of the recent bottom at 78.65 over the next few weeks, possibly a month or two.
That said, the current correction hasn't dented the long term bullish picture. On a successful retest of 78.65 towards the end of the current year, expect the long term trend up to reassert itself.
A fall below $78 is possible but hard to see given the correction so far.
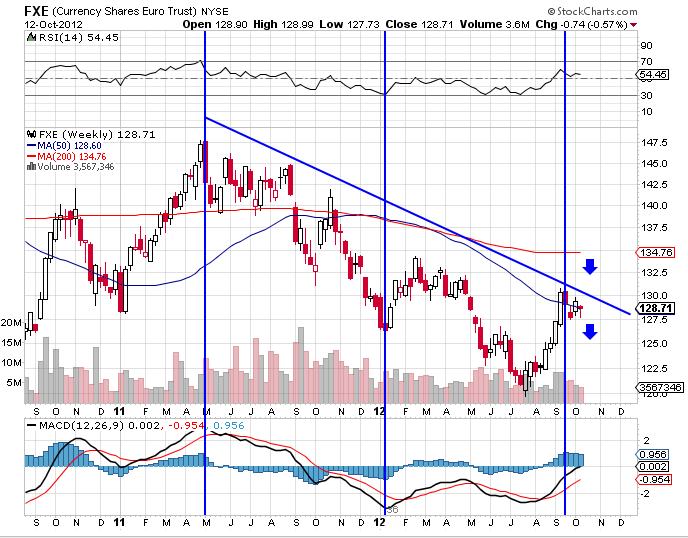
EUROUSD [$FXE]: The euro continued to correct from its recent top at 1.3160 and closed the week at 1.2950 after having made a low 1.2800. The corrective bounce is unlikely to last for long and we can expect the euro to retest, and likely breach the 1.2800
The euro has multiple supports at every handle down to 1.2000 which is also its logical target. But it will take months getting there. Sell rallies and cover at dips. There isn't anything remotely bullish about the currency although it is at battered valuations.
 Dollar-INR: The dollar bounced back from its recent low of 51.50 in INRs and closed the week at 52.80. The dollar could continue to trade between its recent floor at 51.50 and its 200 DMA currently poised at 53. A retest of 51.50 over the next three to four weeks is highly likely. A successful retest of the 51.50 would be pretty bullish for the dollar.
On a successful retest of 51.50, expect the $ to test the 200 DMA and thereafter trade within the triangle shown above.
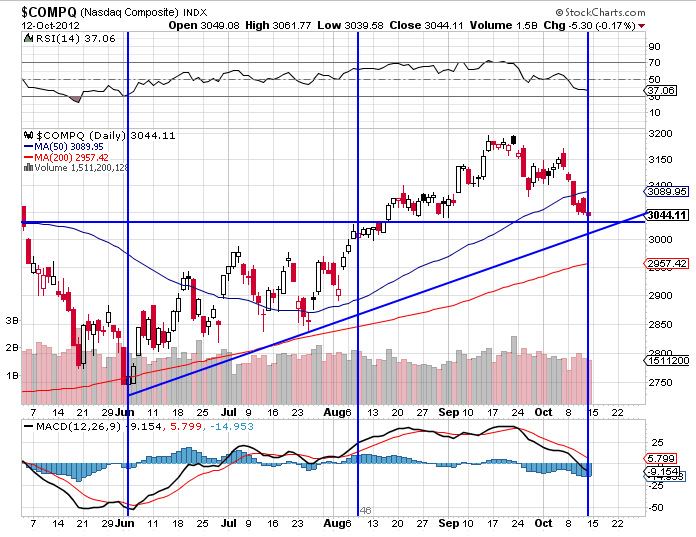 NASDAQ Composite [$COMPQ]: NASDAQ Comp continued its correction from the recent top of 3201 and closed the week at 3044.11. Considering we are now in a fairly mature bull markets as far as US equities are concerned, the major issue is if the market has topped out. The index's 200 DMA and its first support lie at 2970. The first serious breach of support will happen if the index breaks this level. Place tight stops under it.
That said, NASDAQ is in a very strong uptrend and has both time and wave counts to support an extension of the current uptrend until the first quarter of next year. Its current target appears to be in the 3400 to 3500. That may or may not happen but the index has room to get there as long as key supports aren't breached. Remember, we are the very last phase of the bull market which itself is on an extension!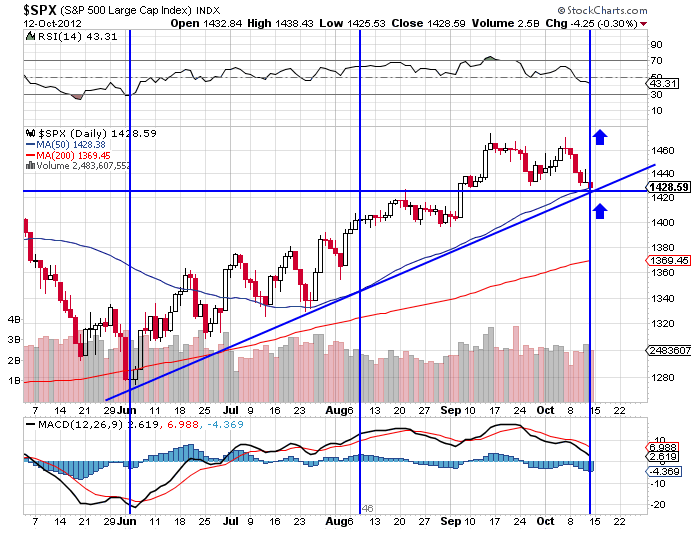 S&P500 [$SPX]: The picture on the S&P 500 is not very different from that of NASDAQ Comp. We would love to know how far this bull move that began in March 2009 from a level of 667 can run. The index closed last week at 1428.59, having made a high of 1474.51 in September.
SPX's correction from the top of 1474 has been orderly and constructive so far. The first critical support lies at 1420. As long as this level is not breached, there is little technical damage to the bull run that remains in play. So place tight stops under that point.
On the other hand, should market rebound from current levels , and make a new high atop 1475, we can be fairly certain that the bull run is all set for the previous top of 1580 or perhaps a wee bit higher. It all depends on [a] when and where the current correction halts, and [b] how quickly a new high is made after this correction is over. 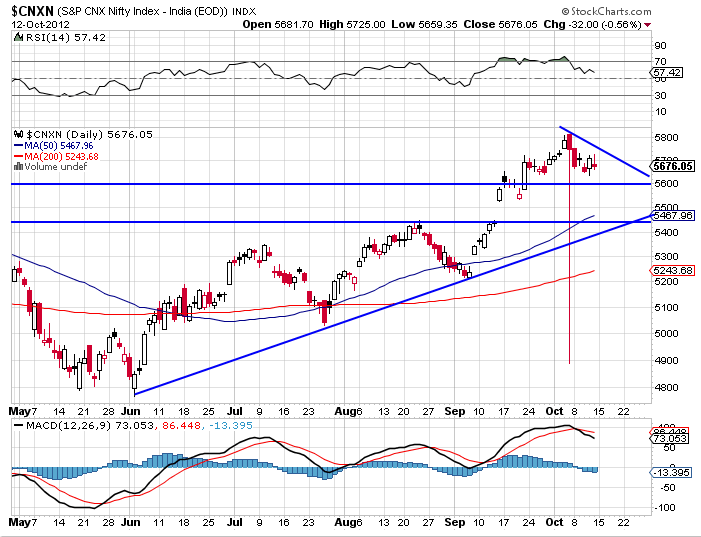 NIFTY [$CNXN]: NIFTY continued its correction from the recent top of 5812 and closed the week at 5676.05. The correction is likely to continue till the end of October with minor pullbacks on the way unless it ends earlier. Nifty's first major support lies at 5540, just above the gap and a more substantial one at 5400.
Technically speaking, the NIFTY should ideally be heading in the 4900 to 5100 area in the last leg of the correction that began from 6335 in November 2010. On the other hand, the market's wave-counts from the rally up from October 28, 2008, level of 2526 is not very different from that of the US markets, albeit the structure is not as over stretched as that of SPX or NASDAQ. So could the rally in Nifty also "extend" after a running correction till the end of the month triggered by the famous intra-day crash to 4900?
The balance of probability favours an extension. Again, this is very treacherous territory in a very mature bull markets. So enjoy the ride but keep tight stop losses. Focus on blue chips which are still at attractive valuations on the buy side.
Note, the Indian market now has many moving parts, not all of which are in sync. So the general direction shown by the index may be right but specific sectors have their own trajectory and timing.
NB: These notes are just personal musings on the world market trends as a sort of reminder to me on what I thought of them at a particular point in time. They are not predictions and none should rely on them for any investment decisions.
Sonali Ranade is a trader in the international markets


 © 2025