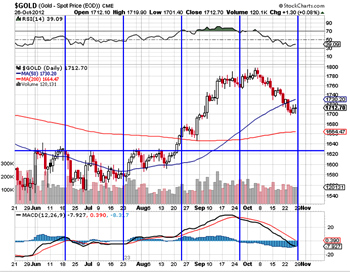
 Gold [$GOLD]: As expected last week, gold continued to correct from its recent top at $1795 to end the week at $1710.30. While this correction is far from over, a minor pullback in prices is now due after which the metal could retest its support around its 200 daily moving average currently positioned at $1661.
The metal's future trajectory will be determined by the market's reaction to the metal around its 200 DMA. Should the support hold, a robust rally in the metal can be expected, which may see the metal retest its previous top in the next few months.
Gold's test of its support around its 200 DMA will take weeks, not days. The market's reaction to the metal in the $1660 area will be critical. A failure to hold support at $1660 will imply a fall to $1525.
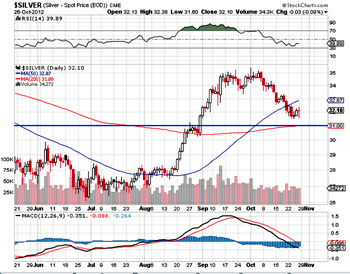 Silver: Like gold, silver too is correcting from its recent top at $35 and is now approaching its 200 DMA area in the $31 region. It closed last week at $32.06.
The metal is due for a counter-trend pullback from the $31 area and could head towards $35. However, the metal's pullback from its recent low of $26 has been weak and unimpressive. A pullback beyond $35-37 region looks highly unlikely which puts the metal in a long term downtrend.
WTI Crude: Crude broke through my stop at $88 negating my last wave count which was bullish. It closed the week at $86.28.
Crude has strong support between $84 and $86 after which the possibility of a retest of the $78 level exists. I could argue that the break below my stop of $88 by a small margin was something to be overlooked but will not do so because the breach invalidated my wave count.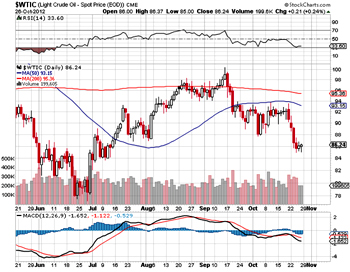
Nevertheless, it is pertinent to point out that on long-term daily charts, the rising trend line from $35 in February 2009 through $78 in June 2012 is intact and my bullish prognosis on crude continues to hold. I will not be surprised to see crude rebound from the $86 region. However, absent a revalidated wave count, the probability of a retest of $78 cannot be ruled out.
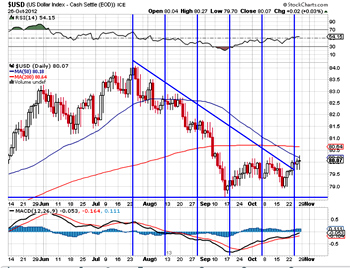 US Dollar: As expected, the $ rallied in a counter-trend making a high of 80.350 against our expected high of 80.50. The counter-trend rally is stronger than one expected and could continue in the ensuing week to test the 200 DMA currently at 80.54.
However, the correction in the $ from its recent top at 84.25 is far from over. So the $ is likely to be capped around its 200 DMA. Look to sell the $ at rally highs in the 80.50+ region.
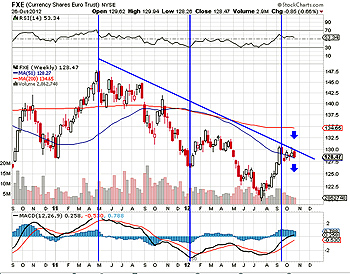 Euro$: Repeating last week commentary as it continues to hold:
As expected, the euro$ continued to correct from its recent top at 1.3175 and closed the week at 1.3021. The euro did attempt a counter-trend rally from the low of 1.28 for the previous top but turned down well before that level.
Barring small counter-trend rallies, the euro is now set for a retest of 1.28 level in the next few weeks. If that level is breached decisively, the currency would unleash a destructive C wave its ongoing correction from the top of 1.5000 whose target could be 1.2000.
So watch the 1.2800 level like a hawk. Keep a stop loss just above 1.32 for shorts. A rally above that level will negate this analysis.
Euro$ should continue to move side to down over the ensuing week. It closed Friday at 1.2939 after making a low of 1.2881.
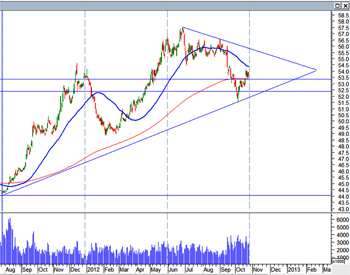 $-INR: As expected the $ turned down from INR 54, but contrary to expectations, has decided to consolidate above its 200 DMA at 53.15.
The $ could continue its consolidation above its 200 DMA for the ensuing week capped at the top by 54. Rather difficult to see how a $ rally can build up from here without at least an attempt to retest 52.50. Neutral on the $ until it either retests 52.50 or shows a robust base build up just above its 200 DMA.
Nasdaq Comp: With its violation of the rally's base trend line, followed by penetration of the 200 DMA on Friday, Nasdaq Comp has flagged a reversal of the rally from the low of 2335 in October 2011. The question now is the extent and duration of the correction. Further, has the rally from March 2009 low of 1244 been also terminated and reversed?
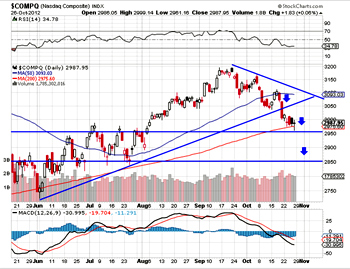 First support for Nasdaq Comp lies at 2950 followed by a more robust support at 2850. Until 2850 is decisively violated, it may be premature to assume that the long-term rally from March 2009 lows is over. In fact there could be a small counter-trend rally from 2950 before further declines are seen.
The correction in the Nasdaq will take a while to unfold and could continue March-April 2013. Further confirmation would come on a violation of 2950 after a small bounce from current levels.
S&P 500: S&P 500 has formed what looks like a triple top at 1474 and violation of the "neck line" at 1428 has confirmed a near term reversal in the index. The SPX has also violated the rally's base trend line from the low 1266 in April 2012.
First support for the index lies at 1400 followed by a more 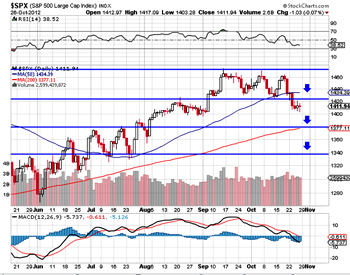 robust support at 1360. One could see a modest bounce from first support but it's unlikely to last long. The index's 200 DMA is at 1370. Future trajectory of this correction will depend on the market's reaction to the prices in the 1360/70 area.
Much like the NASDAQ, SPX too could be in a running correction to the long-term rally from the lows of March 2009. SPX looks stronger than NASDAQ on current form.
CNX NIFTY: Reproducing last week's chart to show how NIFTY bucked the downtrend by consolidating above 5540 even as it kept in step with the correction in US markets. Clearly, NIFTY intends to chart its own course although it may keep in step with US markets as far as direction goes while keeping the distance under its own steam.
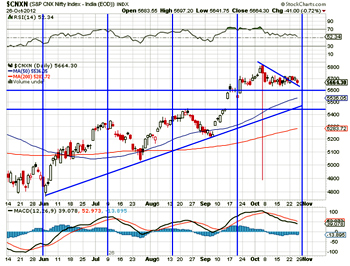 The NIFTY could see a bounce from 5640 levels over the ensuing week. The extent & robustness of the bounce will provide clues to NIFTY's future trajectory. That said, 5815 should be treated as a near-term top and the current fall a correction from that level unless proved otherwise.
NB: These notes are just personal musings on the world market trends as a sort of reminder to me on what I thought of them at a particular point in time. They are not predictions and none should rely on them for any investment decisions.
Sonali Ranade is a trader in the international markets


 © 2025