Where do the commodities market go in the new year? Sonali Ranade offers an insight.
Commodity markets in general are in the very early stages of recovery but all of them aren't likely to move in tandem. Here I take a look at the CRB Index for 17 commodities, the Aussie Dollar vs US dollar, and the price trends in Gold, Silver, Copper and WTI Crude.
This article should be read together with my earlier one on global currency markets. An article on equity markets follows.
 CRB Index
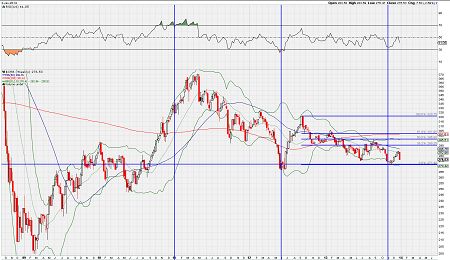
I have shown the weekly chart of the $CRB commodity Index to get a good fix of where we stand in the ongoing commodity correction cycle after the great crash in 2008.
My sense is that we have seen the second leg of the correction in commodities commence from 370.88 on April 29, 2011, play out in two halves and end in the bottom on November 19, 2013, at a low of 272.9. Note the low of November 2013 was marginally higher than the low formed in June 2012 at 267.40.
We should therefore now expect the index to bid higher and try for the region between 325 and 335 over the next 12 to 18 months. The probability of a lurch below 270 is extremely low.
That said, the Index moved to a high of 285.3 from the low 272.9 in November, which to my mind represents the first of many legs of a move to the upside. The sharp selloff from there is simply a correction to the first leg up. The index closed at 277.12 on Friday showing a retracement of 66% from the top. While not ruling out a 100% retracement, my sense is that the index will turn up come Monday and after a short consolidation, keep moving up towards 325. The move up is also corrective. We aren’t done with commodity correction as yet.
 Gold
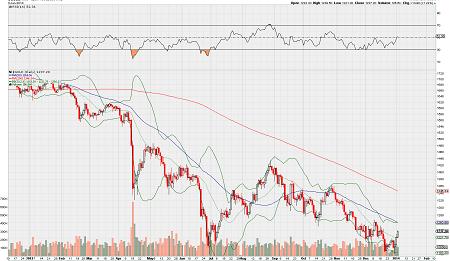
GoldI had expected gold to at least try and breach the low of $1179 formed on June 28, 2013. In the event, gold got close to that level, making a low of $1181.40 on December 31, 2013.
Gold closed last Friday at $1238.60. Barring the usual short-term corrections, I don’t think we will see another attempt to take out $1180 in this leg of the correction.
On the other hand, Gold is now set on a corrective move upwards and could move to $1450 to $1500 range by mid-April. The long-term prognosis for the metal continues to be bearish. However, don’t short gold till you see the highs of mid-April.
 Silver
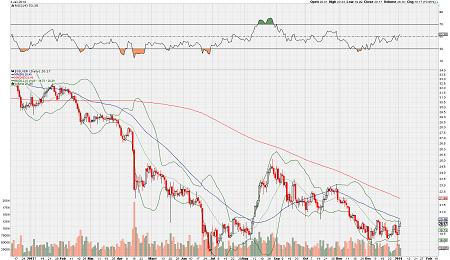
I have been expecting a divergence between gold and silver prices but there simply hasn’t been a spectacular one of the sort I thought should happen. There are significant differences in the pattern of correction underway in both metals though.
Silver could show a muted uptrend in prices in sympathy with gold over the next few weeks and move up to $22-$25 range. However, I continue to expect a price breakdown in silver by June-end 2014. To my mind there is no tradable opportunity in the metal to the upside until we see capitulation below $18.
 HG Copper
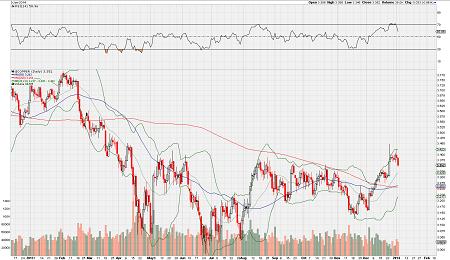
Copper remains the most bullish” of metals in the CRB Index. It made a low of 2.9875 on June 24, 2013, and then tested its 200 DMA repeatedly before making a higher low of 3.1240 on November 19, 2013. Thereafter, the metal took out the top of its 6-month trading range by breaking convincingly atop 3.35, putting up a bullish flag to make a high of 3.4245 on January 2, 2014.
Meanwhile, the metal’s 50 DMA has pierced through its 200 DMA from below in the region of 3.26 well below the current price of 3.35 signaling a golden cross.
My sense is the metal will move up a bit, to perhaps 3.50 or so and do a flattish correction that tests the previous trading range top a few times before breaking away upwards. Position traders could long the metal at dips with a stop-loss a notch below 3.25.
 WTI Crude
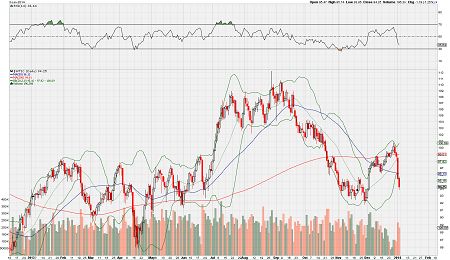
WTI Crude has been in a corrective uptrend from the low of $77.50 made on June 22, 2012 to the high of $109.22 made on August 28, 2013. It has been correcting from that high and made a low of $92.30 on November 27, 2013. In the process, Crude generated a sell signal with the 50 DMA piercing through the 200 DMA to the downside at $98.47. Crude rallied from the low of $92.30 to nick the 200 DMA and turned down again from there, taking out both the 200 & 50 DMAs in the process. All told, that’s a sharply bearish picture but its very sharpness suggests that it might just be the usual bullish correction in an uptrend.
That said, first supportfor WTI crude lies at $92.30 and I would be surprised to see a significant breach of $92 given that the commodity is already oversold. A more robust support follows at $87. While Crude could bounce along above $92 till mid-March 2014, I would look to accumulate the lows around $90-92. There isn’t much downside to WTI crude below $92 because it’s pretty much done with its long-term cyclical correction from the top of $147.27 in July 2008.
 AUDUSD
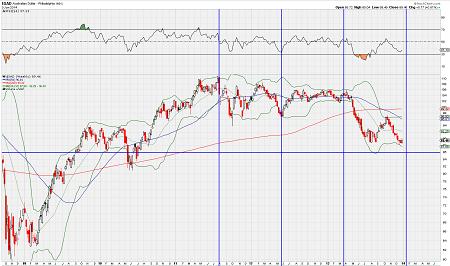
Am unable to show the spectacular textbook bullish run up in the Aussie Dollar vs US Dollar here. But in many ways the story of $XAD from the low of 0.47730 in April 2001 to a high of 1.1080 on July 27, 2011, is the story of the Chinese demand for Aussie commodities. It is therefore interesting to see what $XAD is doing at the moment.
$XAD went into a sharp correction from the level of 1.108 and is currently placed at 0.8943, showing a retracement of 34% from the bottom to the top. My sense is we could see a retracement to 0.80, which is top of the previous long term trading range for the $XAD from 1985 to 2007.
The other interesting thing about the $XAD is the timing. According to one wave count, the earliest end to $XAD’s correction would be around mid-March and, if so, the target could be 0.85. By another count, which I favour, the correction in $XAD could extend to early 2015 and the target could be 0.80. The latter scenario points to delayed recovery in the Chinese economy. In either case $XAD would give early clues torenewed Chinese buying in commodity markets.
NB: These notes are just personal musings on the world market trends as a sort of reminder to me on what I thought of them at a particular point in time. They are not predictions and no one should rely on them for any investment decisions.
Sonali Ranade is a trader in the international markets


 © 2025