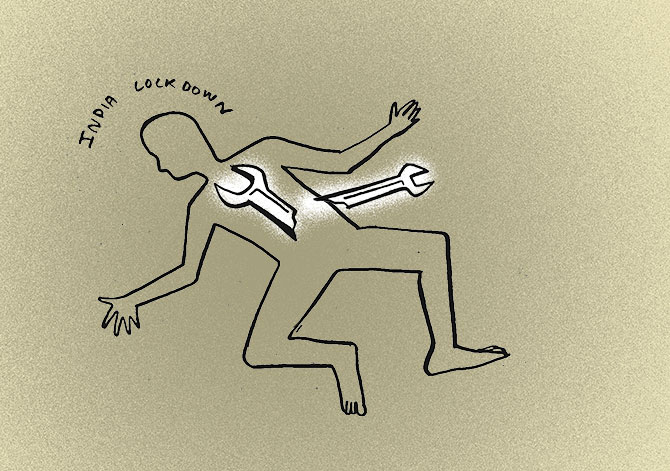
'How do we ensure that the unlocking, which is desperately needed for earning income and livelihood, will not create ugly spikes in the infection rates?'
'And if it does, what then?'asks Omkar Goswami.

Horrors of the COVID-19 pandemic have bred myriad experts across print, television and Facebook.
Only a handful are recognised epidemiologists.
Truth be told, therefore, while we are reading in editorial and op-ed pages about what needs to be done and where we are falling short, not enough of the material is founded on hard data and solid inferences, even if these were suitably caveated.
For most of this piece, I shall put forward the international data collected by the Johns Hopkins Coronavirus Resource Center to share the patterns that have emerged.
Towards the end, I will highlight some conflicts that are bound to occur between health imperatives and economic issues.
The Johns Hopkins database collects and puts up daily numbers on confirmed COVID-19 cases for each country, the cumulative numbers on any given date starting from January 22, 2020, and the number of deaths.
For the United States, it also gives data on the number of tests carried out.
Take any major epidemic or pandemic.
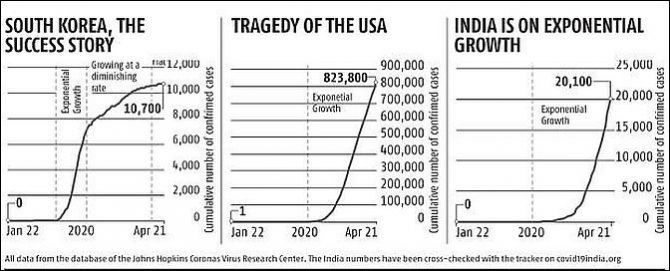
When plotted on a graph, the cumulative number of cases over its lifetime looks like an elongated 'S/ curve: It is initially flat; after crossing 100 cases cumulatively, it invariably rises at an increasing rate with the pandemic exploding; then hits a point of inflection after which it begins to rise at a diminishing rate; and finally it flattens out.
Up to now, over a period of 91 days (from January 22 till April 21, 2020), only one major country has succeeded in completely flattening the COVID-19 curve.
That is South Korea (see Figure 1).
It took 30 days for the total number of cases to cross the three-figure mark.
By March 9 (day 48), it had raced to over 7,500 confirmed cases.
Yet, thanks to extensively rigorous top-of-the-line testing and lockdowns, South Korea slowed the growth and then finally flattened the 'S' curve by mid-April.
You may argue that such is to be expected of a wealthy OECD country with a per capita GDP in excess of $31,400.
If so, contrast that with three other OECD members: Italy, Spain and the United Kingdom.
Italy crossed 100 cases on February 23, 2020 (day 33 since January 22).
While the virus now looks as if it is infecting at a diminishing rate, the cumulative number of cases is far from flat.
In the meanwhile, 183,957 people were infected with 24,648 deaths.

Spain is no better off.
The infection rate took off after day 41 (March 2, 2020).
Now it is probably rising at a decreasing rate, but there is no sign of any flatness.
As on April 21, Spain had 204,178 cases with 21,282 deaths.
If anything, the UK is far worse off.
It crossed 100 cases on March 5 (day 44 from January 22).
Since then, the cumulative number of cases has continued to rise at an exponential rate, without the slightest sign of an inflection point.
On April 21, the total number of COVID-19 cases in the UK was 130,184, with 17,378 deaths.
The grisliest situation reigns in the US.
The total number of cases crossed 100 on March 4, 2020 (day 43).
Thanks to boastful prevarications, fabrications and inaction of the country's chief executive -- undoubtedly the worst US president over the last eight decades -- coupled with the notion of individual 'freedom' touted by some state governors, nothing much was done for weeks in many parts of country despite sound medical advice to the contrary.
Thus, as seen in Figure 2, the number of cases continues to rise at a rapidly growing rate, without any sign of it toning down for the country as a whole.
As on April 21, the US had 825,306 confirmed cases with 45,075 deaths.
That brings me to the confirmed cases in India, depicted in Figure 3.
Forget about under-reporting which, given the size of the country and relative shortage of testing equipment, is bound to happen.
If correctly accounted for, accurate reporting should not only lift the curve up with an increased number of cases but also probably steepen the slope -- making the picture far worse.
In any event, even with the data that we have, it is clear that we are far from reaching a stage where the total number of cases will rise at a falling rate and then flatten out.
My suspicion is that given the geographical construct of urban India with vast numbers of poor people living in slums and shanty-towns that dot our cities, we will continue to see cases rising at an increasing rate for another 45 to 60 days.
Which will cause an enormous policy conundrum: that of balancing human health concerns with one of livelihood.
Literally, millions of poor people have lost their jobs.
Tens of thousands of small enterprises -- be these in manufacturing, construction or services -- have no idea how and when to restart their businesses.
We have locked down the nation for 40 days. Unlocking will be even tougher.
How do we ensure that the unlocking, which is desperately needed for earning income and livelihood, will not create ugly spikes in the infection rates?
And if it does, what then?
How will we deal with the reverse migration that must necessarily occur when construction, manufacturing and services open up?
Where will these workers live?
And what will ensure that living in shifts in bastis -- often five to seven per room -- and sharing unsanitary toilets will not recreate fecund ground for the deadly virus?
As I write, 170 of the 720 districts of India have been put in the 'red' zone.
There are some 80 fully locked down containment areas in Delhi alone.
The tension between livelihood and public health will not disappear for a while.
And while it remains, chief ministers will take their own call on how to act -- one in which getting people back to work may unfortunately take the backseat.
Which is a pity, because it portends to longer pain and downcycle than what we might have ever imagined.
Pray that it doesn't come to that.
Omkar Goswami is chairman, CERG Advisory Private Limited.


 © 2025