A look at his T20 Internationals numbers and one wonders why M S Dhoni was dropped for the T20 series against the Windies and Australia.
His T20I numbers are quite decent and there is no sudden dip in his form, notes Rajneesh Gupta.
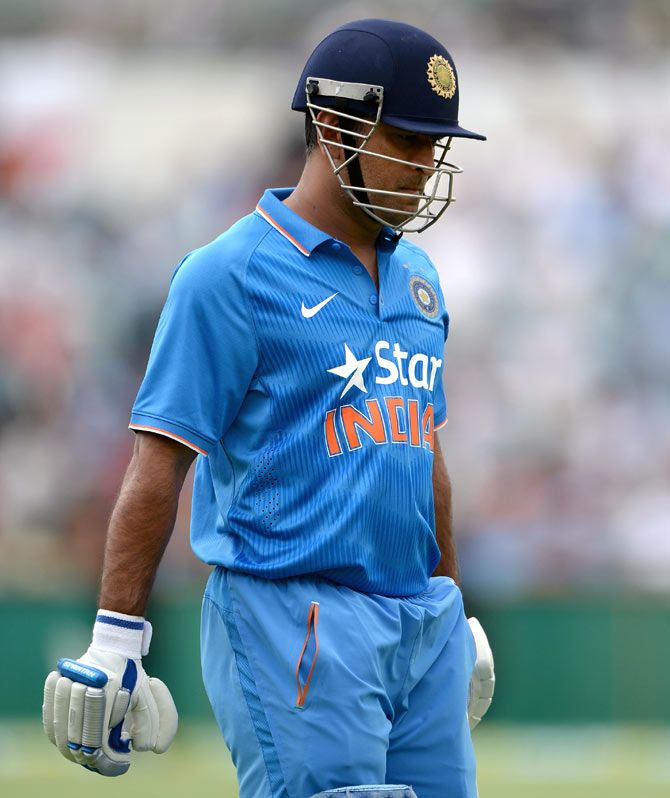
India's selectors made a surprise decision to drop Mahendra Singh Dhoni from the T20I squads for the West Indies and Australia series.
A look at his numbers and one wonders about the rationale for this decision. Dhoni's T20 Internationals numbers are quite decent and there is no sudden dip in his form.
Have a look at the table below:
Dhoni in T20 Internationals
| Innings | Not Out | Runs | Average | 100s | 50s | Strike Rate | |
|---|---|---|---|---|---|---|---|
| upto 2017 | 75 | 38 | 1,364 | 36.86 | 0 | 1 | 125.02 |
| in 2018 | 5 | 2 | 123 | 41.00 | 0 | 1 | 155.70 |
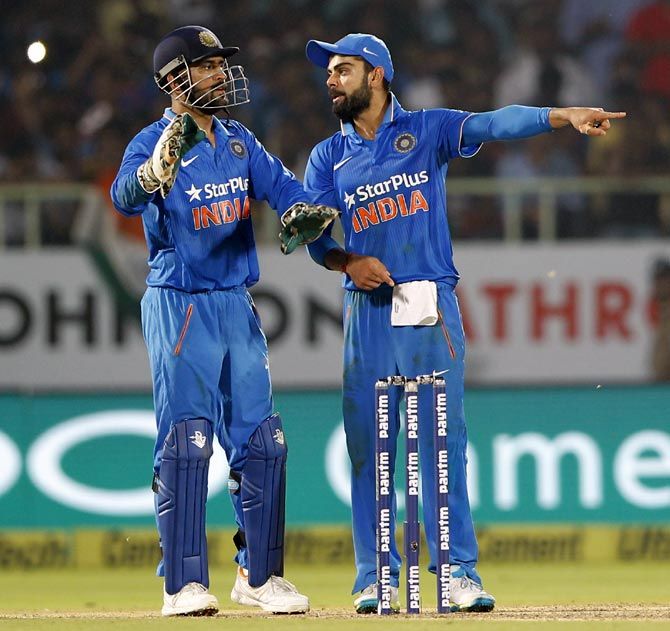
Dhoni has been ahead of Virat Kohli on both strike rate and average not just this year but in the last two years as well! Take a look:
Indian batsmen in T20Is since 2017
5 innings or more
| Innings | Not Out | Runs | Average | 100s | 50s | Strike Rate | |
|---|---|---|---|---|---|---|---|
| Dinesh Karthik | 9 | 7 | 169 | 84.50 | 0 | 0 | 183.70 |
| Hardik Pandya | 15 | 6 | 193 | 21.44 | 0 | 0 | 159.50 |
| Rohit Sharma | 22 | 1 | 722 | 34.38 | 2 | 4 | 154.27 |
| K L Rahul | 13 | 1 | 517 | 43.08 | 1 | 4 | 153.41 |
| Shikhar Dhawan | 18 | 1 | 561 | 33.00 | 0 | 5 | 145.71 |
| M S Dhoni | 17 | 8 | 375 | 41.67 | 0 | 2 | 143.68 |
| Suresh Raina | 14 | 0 | 402 | 28.71 | 0 | 2 | 141.05 |
| Virat Kohli | 17 | 3 | 445 | 31.79 | 0 | 2 | 139.06 |
| Manoj Pande | 17 | 9 | 448 | 56.00 | 0 | 2 | 128.00 |
| Shreyas Iyer | 5 | 0 | 83 | 16.60 | 0 | 0 | 103.75 |
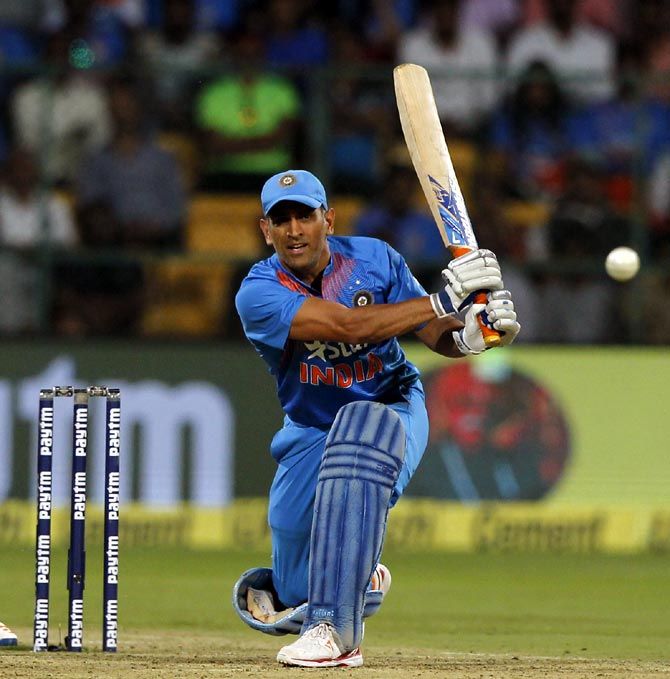
Indian batsmen in T20Is in 2018
5 innings or more
| Innings | Not Out | Runs | Average | 100s | 50s | Strike Rate | |
|---|---|---|---|---|---|---|---|
| Hardik Pandya | 6 | 5 | 117 | 117.00 | 0 | 0 | 201.72 |
| Dinesh Karthik | 6 | 5 | 98 | 98.00 | 0 | 0 | 200.00 |
| KL Rahul | 6 | 1 | 238 | 47.60 | 1 | 1 | 171.22 |
| M S Dhoni | 5 | 2 | 123 | 41.00 | 0 | 1 | 155.70 |
| Shikhar Dhawan | 12 | 0 | 434 | 36.17 | 0 | 4 | 148.12 |
| Rohit Sharma | 13 | 1 | 439 | 36.58 | 1 | 3 | 144.88 |
| Suresh Raina | 11 | 0 | 298 | 27.09 | 0 | 1 | 143.96 |
| Manoj Pande | 9 | 6 | 276 | 92.00 | 0 | 1 | 127.19 |
| Virat Kohli | 7 | 1 | 146 | 24.33 | 0 | 0 | 117.74 |
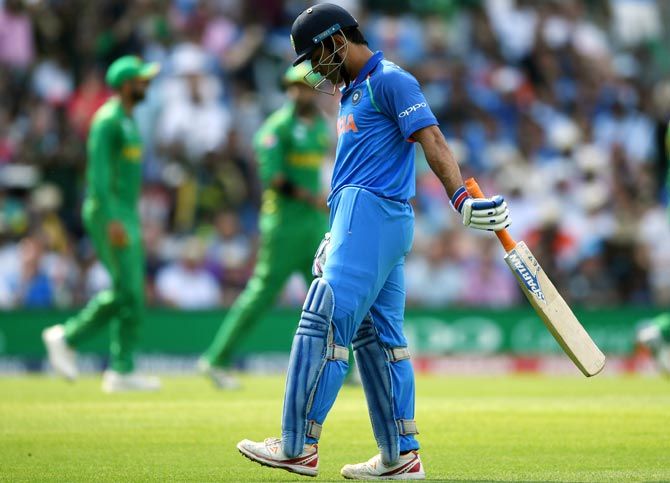
It is quite likely that Dhoni has been dropped from the T20I squads on the basis of his current ODI form.
No doubt, Dhoni has been struggling in ODIs of late. And this year has been abysmal. Take a look:
Dhoni in ODIs
| Innings | Not Out | Runs | Average | 100s | 50s | Strike Rate | |
|---|---|---|---|---|---|---|---|
| up to 2017 | 268 | 76 | 9,898 | 51.55 | 10 | 67 | 88.46 |
| in 2018 | 11 | 2 | 245 | 27.22 | 0 | 0 | 68.24 |
Among all batsmen who have faced 200 or more balls between overs 30 and 50 in ODIs in 2018, Dhoni has the worst strike rate.
That there is a difference of more than 25 points between Dhoni and Joe Root (who is at number 6 in this table) is an eye-opener.
That Dhoni has hit only 2 sixes in this period is a clear indication that his hitting skills are on the vane.
Lowest batting strike rate in overs 30 and 50 in 2018
(minimum 200 balls faced)
| Batsman | Balls | Runs | Dismissals | Average | Strike Rate | Fours | Sixes |
|---|---|---|---|---|---|---|---|
| M S Dhoni | 255 | 179 | 8 | 22.37 | 70.19 | 12 | 2 |
| Peter Moor (Zimbabwe) | 223 | 165 | 6 | 27.50 | 73.99 | 9 | 7 |
| Gary Wilson (Ireland) | 209 | 163 | 6 | 27.16 | 77.99 | 5 | 3 |
| Shai Hope (West Indies) | 248 | 200 | 3 | 66.66 | 80.64 | 9 | 5 |
| Hashmatullah Shahidi (Afghanistan) | 203 | 171 | 4 | 42.75 | 84.23 | 14 | 0 |
| Joe Root (England) | 311 | 298 | 5 | 59.60 | 95.81 | 15 | 4 |
| Mahmudullah (Bangladesh) | 259 | 250 | 8 | 31.25 | 96.52 | 13 | 10 |
| Jason Holder (West Indies) | 214 | 212 | 9 | 23.55 | 99.06 | 10 | 9 |
| Sikandar Raza (Zimbabwe) | 371 | 368 | 8 | 46.00 | 99.19 | 31 | 10 |
Note: The data excludes the third ODI between Bangladesh and Zimbabwe.


 © 2025