 | « Back to article | Print this article |
Williamson is MVP of India-NZ ODIs; Shami is top Indian
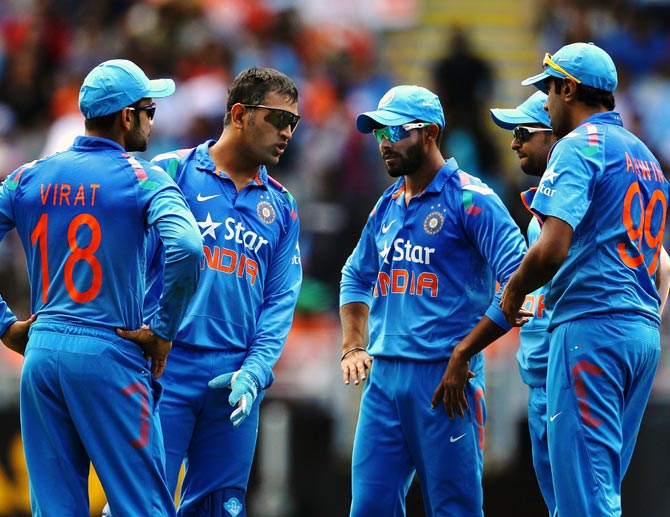
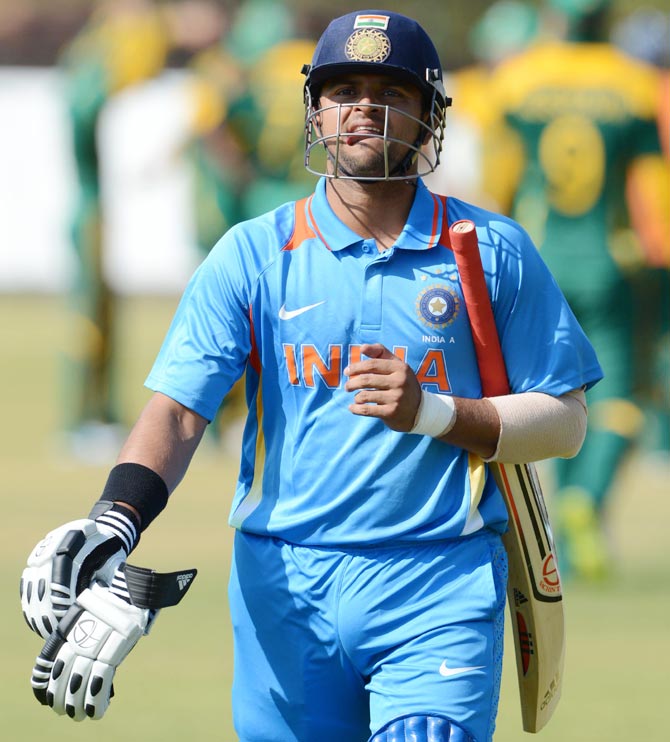
Only Virat Kohli, Mahendra Singh Dhoni and Mohammed Shami justified their selection, while all-rounder Ravindra Jadeja did just enough to hang on. The others, notably Suresh Raina, Ajinkya Rahane, Shikhar Dhawan, Ravichandran Ashwin and Ishant Sharma, did practically nothing in the ODI series in New Zealand, which India lost 0-4.
Srinivas Bhogle and Purnendu Maji list the most valuable players of the just-concluded series, and also analyses how Indian players fared in the 2013-14 season.
New Zealand provided further evidence after South Africa that India simply finds it hard to win away from home, when conditions get even moderately unfriendly.
But what was the reason for World champions India's meek surrender against the Kiwis? Did India give up too easily? Are our bowlers really so bad? Were the players afraid of getting injured before the seventh edition of the Indian Premier League later this year? Did the New Zealand players over-perform because they were mindful of the forthcoming IPL auction?
A devout India cricket fan might accuse us of casting unwarranted aspersions, but there seems to be no doubt that the IPL has changed the mindset of the cricketers. We will, however, be delighted to be proved wrong.
Table 1 compiles the list of the most valuable players of the New Zealand-India ODI series. The most valuable player index (MVPI) formula picks out batsmen who score a lot of runs at a high strike rate and bowlers who take a lot of wickets at a low economy rate, and expresses a player's overall batting + bowling + fielding performance in terms of a 'run equivalent'.
The table shows that the team carrying more 'passengers' lost. For India, only Virat Kohli, Mahendra Siingh Dhoni and Mohammed Shami justified their selection, while all-rounder Ravindra Jadeja did just enough to hang on. The others, notably Suresh Raina, Ajinkya Rahane, Shikhar Dhawan, Ravichandran Ashwin and Ishant Sharma, did practically nothing.
For New Zealand, only Brendon McCullum and Jesse Ryder under-performed; but they still batted aggressively enough to help the team's cause.
Table 1: Most valuable players in the New Zealand - India series (Jan 19-31, 2014):
Rank | Player | Team | Runs | Str Rate | W | Eco | M | MVPI |
1 | Kane Williamson | NZ | 361 | 85.5 | 4 | 6.8 | 5 | 516 |
2 | Corey Anderson | NZ | 120 | 193.5 | 10 | 6.6 | 3 | 482 |
3 | Mohammed Shami | IND | 24 | 88.9 | 11 | 7.2 | 5 | 417 |
4 | Virat Kohli | IND | 291 | 102.5 | 1 | 5.1 | 5 | 384 |
5 | Ross Taylor | NZ | 343 | 88.2 | 0 | - | 5 | 372 |
6 | Ravindra Jadeja | IND | 145 | 125 | 4 | 5.2 | 5 | 347 |
7 | Mahendra Singh Dhoni | IND | 272 | 92.2 | 0 | - | 5 | 336 |
8 | Tim Southee | NZ | 30 | 115.4 | 8 | 5.8 | 4 | 305 |
9 | Martin Guptill | NZ | 214 | 76.7 | 0 | - | 5 | 216 |
10 | Luke Ronchi | NZ | 97 | 183 | 0 | - | 5 | 212 |
11 | Bhuvneshwar Kumar | IND | 41 | 107.9 | 4 | 5.4 | 5 | 174 |
12 | Mitchell McClenaghan | NZ | 3 | 50 | 5 | 6.2 | 4 | 170 |
13 | Ravichandran Ashwin | IND | 94 | 127 | 1 | 5.2 | 5 | 168 |
14 | Varun Aaron | IND | 2 | 50 | 4 | 7 | 3 | 148 |
15 | Brendon McCullum | NZ | 102 | 122.9 | 0 | - | 5 | 135 |
16 | Suresh Raina | IND | 84 | 101.2 | 1 | 5.5 | 3 | 128 |
17 | Rohit Sharma | IND | 145 | 71.8 | 0 | - | 5 | 127 |
18 | Jesse Ryder | NZ | 94 | 113.3 | 0 | - | 5 | 124 |
19 | James Neesham | NZ | 34 | 178.9 | 1 | 7.6 | 2 | 123 |
20 | Hamish Bennett | NZ | 3 | 42.9 | 3 | 5.7 | 2 | 98 |
21 | Ishant Sharma | IND | 6 | 54.5 | 2 | 7.9 | 2 | 96 |
22 | Matt Henry | NZ | 0 | - | 4 | 3.8 | 1 | 93 |
23 | Shikhar Dhawan | IND | 81 | 66.9 | 0 | - | 4 | 84 |
24 | Kyle Mills | NZ | 2 | 100 | 4 | 4.4 | 3 | 84 |
25 | Ajinkya Rahane | IND | 51 | 58.6 | 0 | - | 5 | 80 |
26 | Nathan McCullum | NZ | 4 | 36.4 | 2 | 4.6 | 5 | 49 |
27 | Ambati Rayudu | IND | 57 | 58.2 | 0 | 7.7 | 2 | 40 |
28 | Adam Milne | NZ | 0 | - | 1 | 5.3 | 1 | 28 |
29 | Stuart Binny | IND | 0 | - | 0 | 8 | 1 | 3 |
Runs (scored) ' Strike rate ' W: Wickets taken ' Eco: Economy rate ' ' M: Matches played ' MVPI: Most valuable player index = sum of batting, bowling and fielding points '*Run outs are counted as 1 (wicket) for a direct hit, and 0.5 (wicket) if the fielder is an equal participant in a run out dismissal.
Williamson is MVP of India-NZ ODIs; Shami is top Indian
Table 2, which shows India's most valuable players in the 32 matches played so far in India's 2013-14 season, throws up some puzzles.
Why is Raina persisted with even though he contributes a run equivalent of less than 30 (877/30 = 29.33) per match.
Why is leg-spinner Amit Mishra being denied opportunities even when he contributed an average of over 88 'runs' in the six matches he played this season? Why is there so little 'churn' in the team with nine out of 11 players playing most of the season's matches?
We need answers to some of these questions if we have any hope of retaining the World Cup crown next year.
Table 2: India's most valuable players in the 2013-14 ODI season (32 matches played; 1 abandoned)
Rank | Player name | Runs | Four | Six | Strike Rate | Bat Point | W | Eco | Bowl Point | Field Point | M | MVPI |
1 | R Jadeja | 439 | 42 | 14 | 90.1 | 472.2 | 43 | 5.4 | 1159 | 137.5 | 32 | 1920 |
2 | Virat Kohli | 1391 | 147 | 24 | 101.6 | 1641.2 | 2 | 6.1 | 0 | 87.5 | 32 | 1890 |
3 | S Dhawan | 1243 | 156 | 10 | 95 | 1396 | 0 | 5.7 | 0 | 102.5 | 30 | 1524 |
4 | Rohit Sharma | 1254 | 116 | 38 | 79.4 | 1191.3 | 0 | 4.8 | 6 | 47.5 | 31 | 1273 |
5 | Mohd Shami | 38 | 1 | 2 | 80.9 | 36.8 | 37 | 4.9 | 746.8 | 35 | 20 | 1233 |
6 | MS Dhoni | 787 | 69 | 23 | 99.9 | 917.3 | 0 | 6 | 3 | 230 | 24 | 1219 |
7 | R Ashwin | 225 | 25 | 3 | 98.7 | 260 | 31 | 5.9 | 730.2 | 65 | 27 | 1188 |
8 | B Kumar | 82 | 8 | 1 | 75.2 | 73.2 | 25 | 4.5 | 636 | 82.5 | 23 | 978 |
9 | Suresh Raina | 528 | 48 | 4 | 89.8 | 566 | 6 | 5.4 | 152 | 120 | 30 | 877 |
10 | Ishant Sharma | 11 | 0 | 0 | 36.7 | -3 | 26 | 5.2 | 491 | 27.5 | 17 | 746 |
11 | Amit Mishra | 9 | 1 | 0 | 128.6 | 12.2 | 18 | 7.7 | 450.5 | 10 | 6 | 529 |
12 | Vinay Kumar | 43 | 3 | 2 | 89.6 | 46 | 10 | 5.4 | 124.5 | 22.5 | 9 | 464 |
13 | Umesh Yadav | 1 | 0 | 0 | 9.1 | -7.2 | 12 | 5.5 | 238 | 47.5 | 11 | 332 |
14 | Dinesh Karthik | 255 | 27 | 2 | 70.4 | 208.3 | 0 | 4.2 | 0 | 92.5 | 15 | 301 |
15 | J Unadkat | 0 | 0 | 0 | 0 | 0 | 8 | 0 | 251 | 25 | 7 | 296 |
16 | Yuvraj Singh | 118 | 12 | 3 | 65.9 | 86.8 | 2 | 4 | 19 | 42.5 | 11 | 210 |
17 | Mohit Sharma | 0 | 0 | 0 | 0 | -4.2 | 4 | 5.0 | 69.5 | 5 | 5 | 190 |
18 | Varun Aaron | 2 | 0 | 0 | 50 | 0.7 | 4 | 5.3 | 52.8 | 0 | 3 | 148 |
19 | Ajinkya Rahane | 109 | 9 | 1 | 64.1 | 76.3 | 0 | 3.8 | 0 | 50 | 7 | 127 |
20 | Ambati Rayudu | 158 | 11 | 2 | 60.5 | 98.5 | 0 | 3.6 | -8 | 0 | 6 | 106 |
21 | Murali Vijay | 57 | 7 | 0 | 89.1 | 60.7 | 0 | 5.3 | 0 | 10 | 3 | 71 |
22 | Stuart Binny | 0 | 0 | 0 | 0 | 0 | 0 | 0 | -3 | 0 | 1 | 3 |
22 | C Pujara | 13 | 2 | 0 | 46.4 | 2.7 | 0 | 2.8 | 0 | 0 | 2 | 3 |
Runs (scored) ' Fours ' Sixes ' Strike rate ' Batting points ' W: Wickets taken ' Eco: Economy rate ' Bowling points ' Fielding points ' M: Matches played ' MVPI: Most valuable player index = sum of batting, bowling and fielding points ' ' *Run outs are counted as 1 (wicket) for a direct hit, and 0.5 (wicket) if the fielder is an equal participant in a run out dismissal.

