 | « Back to article | Print this article |
Why Kallis ranks as one of greats of the modern game
Rajneesh Gupta analyses Jacques Kallis's remarkable career in international cricket, and wonders whether we will ever see another complete cricketer like him.
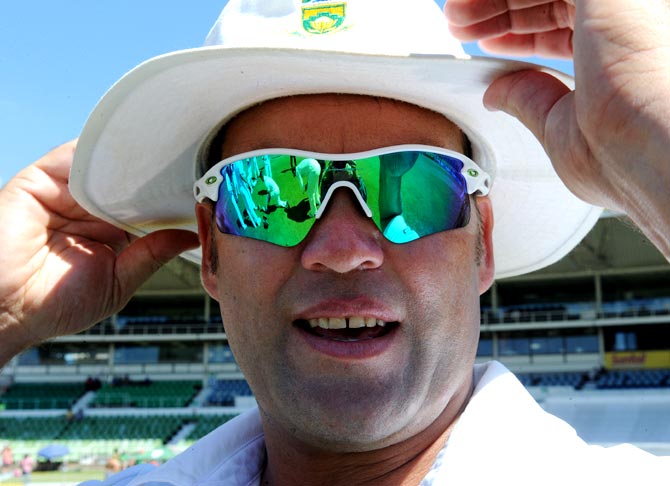
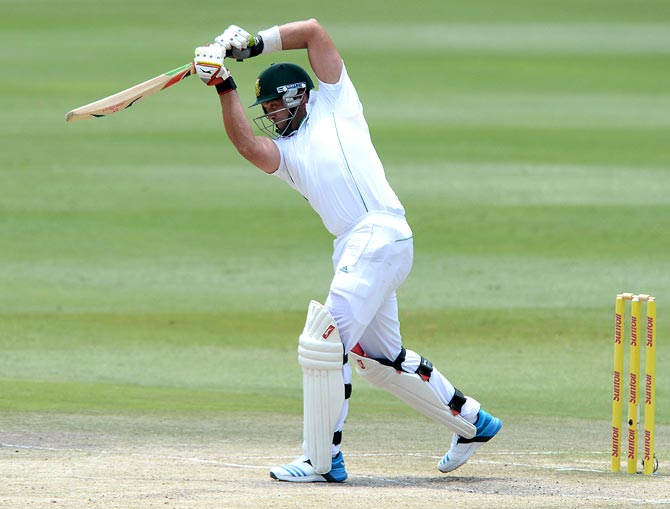
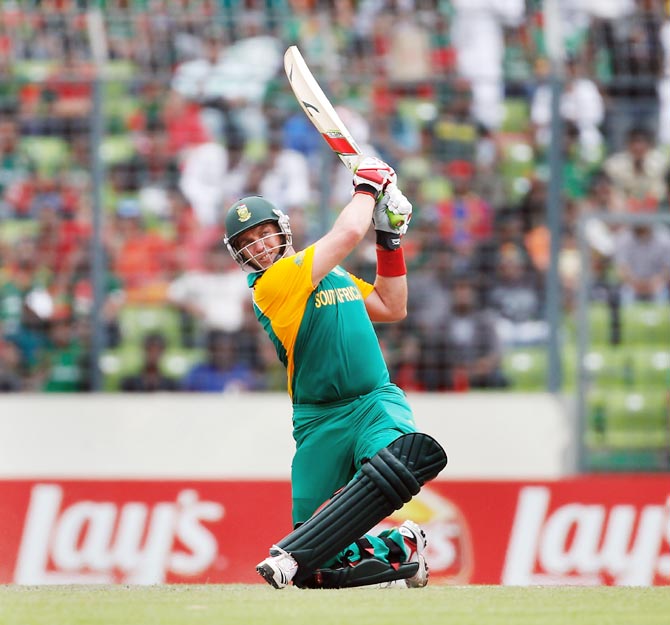
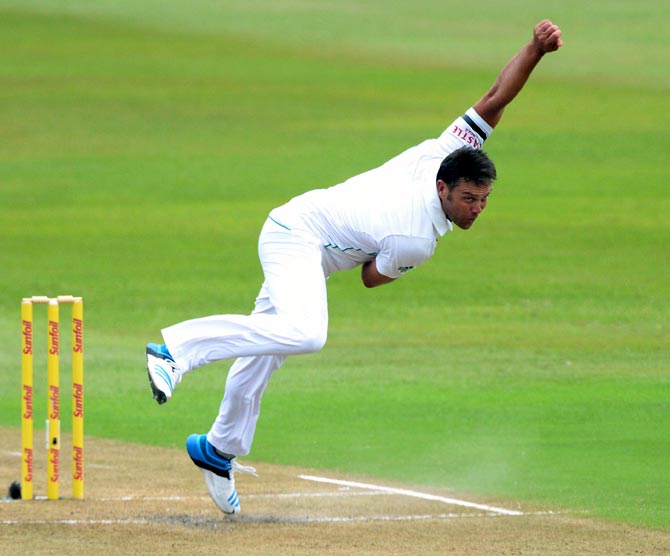
South Africa’s legendary all-rounder Jacques Kallis announced his retirement from all international cricket on Wednesday, bringing an end to one of the most illustrious careers the sport has seen.
One of the true greats of the modern game, his numbers are simply staggering!
He is South Africa’s most successful batsman, both in Tests and One-Day Internationals. And if you add the 292 and 273 wickets he claimed in Tests and ODIs respectively, it gives ample proof of how important a cog he was in South Africa’s wheel for nearly two decades.
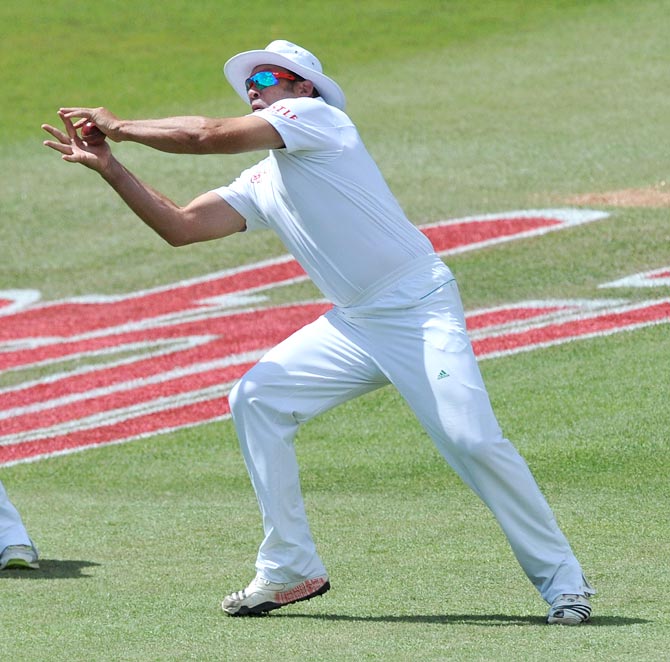
Also, a double century of catches in Tests and a century of catches in ODIs -- mostly in the slips – ranks him among the safest fielders in the game.
Check out Kallis's amazing record in international cricket:
Format | Mts | Runs | Bat Avg | Wkts | Bat Avg | Cts | 6s | MoM | MoS |
Tests | 166 | 13289 | 55.37 | 292 | 32.65 | 200 | 97 | 23 | 9 |
ODIs | 328 | 11579 | 44.36 | 273 | 31.79 | 131 | 137 | 32 | 6 |
T20Is | 25 | 666 | 35.05 | 12 | 27.75 | 7 | 20 | 2 | 0 |
All international cricket | 519 | 25534 | 49.10 | 577 | 32.14 | 338 | 254 | 57 | 15 |
(MoM = Man of the Match, MoS = Man of the Series)
Please click NEXT for more...
Why Kallis ranks as one of greats of the modern game
Career Highlights:
- The only player to score 10,000 runs, take 250 wickets and hold 100 catches both in Tests and ODIs.
- The only player to aggregate 25,000 runs, 500 wickets and 250 catches in international cricket.
- The only South Africa batsman with over 10,000 runs in Tests and ODIs.
- The fourth highest scorer in international cricket, after India's Sachin Tendulkar, Ricky Ponting of Australia and Sri Lanka's Kumar Sangakkara.
- Only Sachin Tendulkar (100) and Ricky Ponting (71) scored more international hundreds than Kallis, who has 62 to his credit.
- Kallis scored hundreds in five consecutive Tests in 2003-04. Only legendary Australian Don Bradman, with six, did better.
- Won 57 man of the match awards in international cricket. Only Tendulkar (76) and Jayasuriya (58) won more.
- Won 15 man of the series awards in international cricket. Only Tendulkar (20) won more.
- Hit 254 sixes in international cricket. Only seven batsmen have hit more sixes than him.
Please click NEXT for more...
Kallis finishes as third highest run getter in Test cricket
Talking of Test cricket first, the following table lists the leading run-scorers in the format.
Kallis is third behind Tendulkar and Ponting in the highest run-scorers' list in Tests, with 13,289 runs in 166 matches.
Only Sangakkara (58.32) has a higher batting average than Kallis (55.37), while only Tendulkar (51) scored more centuries than the South African.
These figures are enough to put Kallis in the same bracket as the game’s greatest names.
But hold on! He also boasts of a rich haul of 292 wickets in Tests, which is more than the combined tally of all the other great names!
| Mts | Runs | Bat Avg | 100s | Wkts | Bowl Avg |
Sachin Tendulkar (Ind) | 200 | 15921 | 53.78 | 51 | 46 | 54.17 |
Ricky Ponting (Aus) | 168 | 13378 | 51.85 | 41 | 5 | 55.20 |
Jacques Kallis (SA) | 166 | 13289 | 55.37 | 45 | 292 | 32.65 |
Rahul Dravid (Ind) | 164 | 13288 | 52.31 | 36 | 1 | 39.00 |
Brian Lara (WI) | 131 | 11953 | 52.88 | 34 | 0 | - |
Mahela Jayawardene (SL) | 147 | 11671 | 50.09 | 34 | 6 | 51.66 |
Kumar Sangakkara (SL) | 126 | 11665 | 58.32 | 36 | 0 | - |
S Chanderpaul (WI) | 156 | 11414 | 51.88 | 29 | 9 | 98.11 |
Allan Border (Aus) | 156 | 11174 | 50.56 | 27 | 39 | 39.10 |
Steve Waugh (Aus) | 168 | 10927 | 51.06 | 32 | 92 | 37.44 |
Sunil Gavaskar (Ind) | 125 | 10122 | 51.12 | 34 | 1 | 206.00 |
Please click NEXT for more...
Kallis's average only second to Tendulkar in ODIs
In One-Day Internationals also, Kallis finds a place among the leading run-scorers, with only Tendulkar beating him on average.
Sanath Jayasuriya has more ODI wickets than Kallis, but the South African has a better average.
Highest run-scorers in One-Day Internationals:
| Mts | Runs | Bat Avg | 100s | Wkts | Bowl Avg |
Sachin Tendulkar (Ind) | 463 | 18426 | 44.83 | 49 | 154 | 44.48 |
Ricky Ponting (Aus) | 375 | 13704 | 42.03 | 30 | 3 | 34.66 |
Sanath Jayasuriya (SL) | 445 | 13430 | 32.36 | 28 | 323 | 36.75 |
Kumar Sangakkara (SL) | 377 | 12806 | 40.39 | 19 | - | - |
Inzamam-ul-Haq (Pak) | 378 | 11739 | 39.52 | 10 | 3 | 21.33 |
Mahela Jayawardene (SL) | 420 | 11681 | 32.90 | 16 | 7 | 79.71 |
Jacques Kallis (SA) | 328 | 11579 | 44.36 | 17 | 273 | 31.79 |
Sourav Ganguly (Ind) | 311 | 11363 | 41.02 | 22 | 100 | 38.49 |
Rahul Dravid (Ind) | 344 | 10889 | 39.16 | 12 | 4 | 42.50 |
Brian Lara (WI) | 299 | 10405 | 40.48 | 19 | 4 | 15.25 |
It is evident from the above numbers that Kallis could have walked in to any international team on the basis of his batting alone.
But his bowling was also quite effective and his all-round skills provided South Africa the required balance and made them one of the top teams in the world.
Please click NEXT for more...
Kallis's record only second to Sobers as an all-rounder
These days, any batsman who rolls his arms occasionally, or any bowler who puts bat to ball is quickly termed as an all-rounder.
But a more serious approach is needed while ranking a group of players. One such method is to subtract a player’s bowling average from his batting average -- the higher the figure, the higher a player’s ranking.
Of course, we need to have some qualification criteria in place so that the irrelevant entries are excluded. This is very important, as Don Bradman, as we all know, had a batting average of 99.94 and claimed two wickets at an average of 36.00.
This gave him a difference of 63.94 in batting and bowling averages. While no one can argue about Bradman being the greatest batsman of all-time, hardly any one will agree that Bradman was also a good all-rounder in Test cricket.
A qualification limit of 1000 runs and 100 wickets gives us sufficient data to look at, while giving all players of their pennies worth a fare chance to feature in the study.
A total of 57 players have accomplished this all-round double. Kallis comes second to only West Indian great Gary Sobers, who is regarded as one of the best all-rounders to have graced the game.
In fact, these two are the only players who have a batting average of over 50 that exceeds their bowling average by 20 points or more!
Highest difference in batting and bowling averages in Tests
(1000 runs and 100 wickets)
| Mts | Runs | Bat Avg. | Wkts | Bowl Avg. | Avg. difference |
Gary Sobers (WI) | 93 | 8032 | 57.78 | 235 | 34.03 | 23.74 |
Jacques Kallis (SA) | 166 | 13289 | 55.37 | 292 | 32.65 | 22.71 |
Imran Khan (Pak) | 88 | 3807 | 37.69 | 362 | 22.81 | 14.88 |
Keith Miller (Aus) | 55 | 2958 | 36.97 | 170 | 22.97 | 13.99 |
Shaun Pollock (SA) | 108 | 3781 | 32.31 | 421 | 23.11 | 9.19 |
Trevor Goddard (SA) | 41 | 2516 | 34.46 | 123 | 26.22 | 8.23 |
Tony Greig (Eng) | 58 | 3599 | 40.43 | 141 | 32.20 | 8.23 |
Monty Noble (Aus) | 42 | 1997 | 30.25 | 121 | 25.00 | 5.25 |
Ian Botham (Eng) | 102 | 5200 | 33.54 | 383 | 28.40 | 5.14 |
Richard Hadlee (NZ) | 86 | 3124 | 27.16 | 431 | 22.29 | 4.86 |
Shakib Al Hasan (Ban) | 34 | 2278 | 37.96 | 122 | 33.39 | 4.57 |
Chris Cairns (NZ) | 62 | 3320 | 33.53 | 218 | 29.40 | 4.13 |
Alan Davidson (Aus) | 44 | 1328 | 24.59 | 186 | 20.53 | 4.06 |
Wilfred Rhodes (Eng) | 58 | 2325 | 30.19 | 127 | 26.96 | 3.22 |
Kapil Dev (Ind) | 131 | 5248 | 31.05 | 434 | 29.64 | 1.40 |
Trevor Bailey (Eng) | 61 | 2290 | 29.74 | 132 | 29.21 | 0.52 |
A similar study in One-Day Internationals puts Kallis right on the top ahead of West Indian batting great Viv Richards.
Highest difference in batting and bowling averages in One-Day Internationals
(1000 runs and 100 wickets)
| Mts | Runs | Bat Avg. | Wkts | Bowl Avg. | Avg. difference |
Jacques Kallis (SA) | 328 | 11579 | 44.36 | 273 | 31.79 | 12.56 |
Viv Richards (WI) | 187 | 6721 | 47.00 | 118 | 35.83 | 11.16 |
Lance Klusener (SA) | 171 | 3576 | 41.10 | 192 | 29.95 | 11.15 |
Shane Watson (Aus) | 173 | 5256 | 41.06 | 163 | 30.26 | 10.79 |
Andrew Flintoff (Eng) | 141 | 3394 | 32.01 | 169 | 24.38 | 7.63 |
Imran Khan (Pak) | 175 | 3709 | 33.41 | 182 | 26.61 | 6.79 |
Shakib Al Hasan (Ban) | 136 | 3835 | 34.86 | 171 | 28.92 | 5.93 |
Hansie Cronje (SA) | 188 | 5565 | 38.64 | 114 | 34.78 | 3.85 |
Sourav Ganguly (Ind) | 311 | 11363 | 41.02 | 100 | 38.49 | 2.53 |
Andrew Symonds (Aus) | 198 | 5088 | 39.75 | 133 | 37.25 | 2.49 |
Chris Gayle (WI) | 255 | 8743 | 37.52 | 157 | 35.38 | 2.13 |
Shaun Pollock (SA) | 303 | 3519 | 26.45 | 393 | 24.50 | 1.95 |
Ravindra Jadeja (Ind) | 101 | 1541 | 33.50 | 120 | 32.58 | 0.91 |
Sachin Tendulkar (Ind) | 463 | 18426 | 44.83 | 154 | 44.48 | 0.35 |
Richard Hadlee (NZ) | 115 | 1751 | 21.61 | 158 | 21.56 | 0.05 |
Please click NEXT for more...
Kallis's record only second to Sobers as an all-rounder
Kallis did not feature in too many Twenty20 Internationals, as South Africa's selectors believed -- for some strange reason -- that his game was not suitable for the format. However, he did not fare too badly in the format as his figures convey.
Putting together the performance in each format of international cricket (Tests, One-Day Internationals and T20 Internationals) and ranking the players again on the same parameter, gives us the following table.
Kallis is again on the top, well ahead of Pakistan’s Imran Khan.
Highest difference in batting and bowling averages in International cricket
(5000 runs and 250 wickets)
| Mts | Runs | Bat Avg. | Wkts | Bowl Avg. | Avg. difference |
Jacques Kallis (SA) | 519 | 25534 | 49.10 | 577 | 32.14 | 16.95 |
Imran Khan (Pak) | 263 | 7516 | 35.45 | 544 | 24.08 | 11.36 |
Shane Watson (Aus) | 270 | 9738 | 37.16 | 271 | 29.82 | 7.34 |
Steve Waugh (Aus) | 493 | 18496 | 41.65 | 287 | 35.56 | 6.09 |
Lance Klusener (SA) | 220 | 5482 | 37.80 | 272 | 32.29 | 5.51 |
Shaun Pollock (SA) | 423 | 7386 | 28.73 | 829 | 23.73 | 5.00 |
Shakib Al Hasan (Ban) | 205 | 6865 | 33.81 | 337 | 29.23 | 4.58 |
Andrew Flintoff (Eng) | 227 | 7315 | 31.39 | 400 | 29.23 | 2.16 |
Ian Botham (Eng) | 218 | 7313 | 29.72 | 528 | 28.44 | 1.28 |
One can draw his own conclusion from the above tables, but one thing is sure: Kallis did not lag behind any of the great names. It is indeed a mystery why he never got the attention that a player of his caliber richly deserved.
Perhaps, he looked stereo-typed to cricket fans because of his no-nonsense approach, or the media had an inherent bias towards the other players.
Some critics claim that his game lacked flair, but it is not true.
The fact that he hit more than 300 sixes and won more than 50 man-of-the-match awards is enough to lay such theories to rest.
All said and done, one wonders if the game will ever see another complete cricketer who can change the course of a match regularly with his batting, bowling or fielding, like Kallis did so successfully for the Proteas.

