 | « Back to article | Print this article |
World's 25 most innovative nations, India way behind!
Which are the world's most innovative countries? While nine out the top 10 innovative nations were already in the top league in 2011, Ireland joins the top group for the first time. Canada is the only country to be out of the top 10 this year.
The Global Innovation Index published by INSEAD, and the World Intellectual Property Organisation (WIPO), ranks 141 countries on the basis of their innovation capabilities.
Though India ranked 2nd in the Global Innovation Efficiency Index, it lags behind 61 counties in terms of innovation.
Among lower-middle-income countries, the best performers. In Southern Asia, India comes first (64th), followed by Sri Lanka (94th), the Islamic Republic of Iran (104th), Bangladesh (112th), Nepal (113th).
India (Rank 62)
Score: 37.5
Innovation Output Sub-Index: 37.3
Innovation Input Sub-Index: 34.0
Innovation Efficiency Index: 1.1
Knowledge & technology outputs: 34.0
Knowledge creation: 28.9
GDP per capita: $3,703.5
GDP: $1,843.4 billion
Click NEXT to read more...
World's 25 most innovative nations, India way behind!
China (Rank 34)
Score: 45.4
Innovation Output Sub-Index: 48.1
Innovation Input Sub-Index: 42.7
Innovation Efficiency Index: 1.1
Knowledge & technology outputs: 61.8
Knowledge creation: 76.1
GDP per capita: $8,394.1
GDP: $6,988.5 bn
The BRIC countries (Brazil, the Russian Federation, India, and China) have been seen as drivers of the global economic engine since 2008 and the slowdown in high-income economies.
But these countries too are slowing down, and despite their unrealized potential, they need to continue to invest in building their innovation infrastructures.
China and India come in at 1st and 2nd place, respectively, in the Innovation Efficiency
Index rankings, demonstrating a great ability to translate pockets of excellence in their innovation infrastructures into valuable innovation outputs.
China's performance on the key knowledge and technology outputs pillar is impressive - the country is outpaced only by Switzerland, Sweden, Singapore, and Finland.
However, ICT is poor in China and Human capital and research needs improvement in India.
Click NEXT to read more...
World's 25 most innovative nations, India way behind!
Pakistan (Rank 133)
Score: 23.1
Innovation Output Sub-Index: 21.8
Innovation Input Sub-Index: 24.3
Innovation Efficiency Index: 0.9
Knowledge & technology outputs: 18.1
Knowledge creation: 4.0 (Rank 124)
GDP per capita: $2,791.8
GDP: $ 204.1 billion
Click NEXT to see the 25 nations that lead in innovation...
World's 25 most innovative nations, India way behind!
1. Switzerland
Switzerland maintains its 2011 position as number 1. It makes it to the top 10 on all four indices and on all pillars except institutions (13th), where it shows relative weaknesses in its business environment, as captured by its relatively poor showing in the ease of starting a business and resolving insolvency.
Switzerland also ranks 1st in national patent applications by residents and through the Patent Cooperation Treaty.
Global Innovation Index score: 68.2
Innovation Output Sub-Index: 68.5
Innovation Input Sub-Index: 68.0
Innovation Efficiency Index: 1.0
Knowledge & technology outputs: 72.0 (Rank 1)
Knowledge creation: 99.7 (Rank 1)
GDP per capita: $43,508.6
GDP: $665.9 billion
Click NEXT to read more...
World's 25 most innovative nations, India way behind!
Sweden
Score: 64.8
Sweden retains its 2011 position and comes in 1st among Nordic and European Union (EU) countries in the GII and its two sub-indices.
It ranks 3rd on inputs and 2nd on outputs, with strengths on all seven pillars. The country ranks 1st in infrastructure, demonstrating a vigorous use of information and communication technologies (ICT).
Innovation Output Sub Index: 60.7
Innovation Input Sub-Index: 68.8
Innovation Efficiency Index: 0.9
Knowledge & technology outputs: 67.9 (Rank 1)
Knowledge creation: 84 (Rank 2)
Click NEXT to read more...
World's 25 most innovative nations, India way behind!
3. Singapore
Score: 63.5
Singapore comes in 3rd on the GII this year, maintaining its 2011 position and leading the rankings among Asian economies.
Its innovation capabilities rank 1st in the world, with a well-trained student body, a robust research community, a skilled labour force, sophisticated financial and commercial markets, and a strong business community.
Innovation Output Sub-Index: 52.0
Innovation Input Sub-Index: 74.9
Innovation Efficiency Index: 0.7
Knowledge & technology outputs: 64.9 (Rank 3)
Knowledge creation: 49.3 (Rank 25)
GDP per capita: $59,937
GDP: $266.5 billion
Click NEXT to read more...
World's 25 most innovative nations, India way behind!
4. Finland
Score: 61.8
Finland has strengths across the board, with a particularly strong institutional framework (6th) and a skilled labour force (1st in the EU, 3rd globally) engaged in research and patenting.
Finland tops the rankings in political environment and five indicators, notably the state of cluster development, royalty and license fees receipts, and computer and communications service exports.
Innovation Output Sub-Index: 56.1
Innovation Input Sub-Index: 67.5
Innovation Efficiency Index: 0.8
Knowledge & technology outputs: 62.9 (Rank 4)
Knowledge creation: 71.1 (Rank 8)
GDP per capita: $36,723.3
GDP: $270.6 billion
Click NEXT to read more...
World's 25 most innovative nations, India way behind!
5. United Kingdom
Score: 61.2
Although UK's performance has improved since last year, when it ranked 10th, the UK benefited to a large extent from adjustments made to the GII framework.
It gained 11 positions in Infrastructure because of its excellent 10th position in ecological sustainability and it tops the rankings in three indicators that are also new this year: cost of redundancy dismissal, ease of getting credit, and generic top-level domains (TLDs). It also has strong institutions and sophisticated financial markets (ranking 1st on credit and 3rd on investment).
Its has an excellent 8th position in knowledge and technology outputs is the result of a good balance between the creation of knowledge through patenting and scientific and technical research (13th), the economic impact of these activities in the domestic economy (11th, although labour productivity has still not fully recovered from the crisis).
Innovation Output Sub-Index: 54.5
Innovation Input Sub-Index: 68.0
Innovation Efficiency Index: 0.8
Knowledge & technology outputs: 57.6 (Rank 8)
Knowledge creation: 63.2 (Rank 13)
GDP per capita: $35,974.4
GDP: $2,481 bn
Click NEXT to read more...
World's 25 most innovative nations, India way behind!
6. The Netherlands
Score: 60.5
The Netherlands has made particularly strong use of ICT, with top 10 rankings in press freedom, ICT access, government's online service, online e-participation, computer software spending, and all four indicators included in online creativity.
Innovation Output Sub-Index: 58.2
Innovation Input Sub-Index: 62.9
Innovation Efficiency Index: 0.9
Knowledge & technology outputs: 59.4 (Rank 7)
Knowledge creation: 66.2 (Rank 10)
GDP per capita: $42,330.7
GDP: $858.3 billion
Click NEXT to read more...
World's 25 most innovative nations, India way behind!
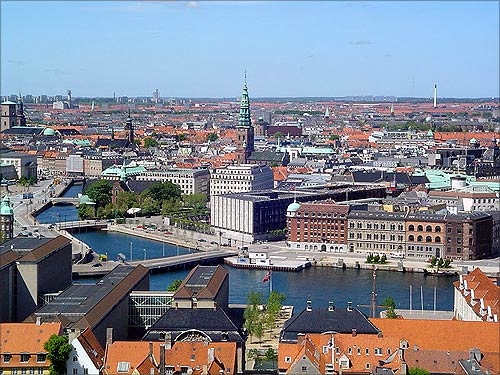
7. Denmark
Score: 59.9
Denmark is assessed as the most transparent and business friendly country in the world. A prepared and well-funded research community (the country ranks 5th on R&D) leads to high degrees of patenting via the PCT and of publishing in scientific and technical journals.
Innovation Output Sub-Index: 52.5
Innovation Input Sub-Index: 67.4
Innovation Efficiency Index: 0.8
Knowledge & technology outputs: 51.5 (Rank 16)
Knowledge creation: 64.4 (Rank 11)
GDP per capita: $37,741.9
GDP: $349.1 billion
Click NEXT to read more...
World's 25 most innovative nations, India way behind!
8. Hong Kong
Score: 58.7
Hong Kong is ranked 8th, a drop of four places from its 4th position in 2011. Its main strength is still on the input side (2nd).
Its rank in innovation outputs (25th) is lower than it was in 2011 because of a relatively low ranking in knowledge and technology outputs (34th), which echoes a relatively low ranking in human capital and research (26th).
Innovation Output Sub-Index: 45.5
Innovation Input Sub-Index: 72.0
Innovation Efficiency Index: 0.6
Knowledge & technology outputs: 38.4 (Rank 34)
Knowledge creation: 5.7 (Rank 119)
GDP per capita: $49,342.0
GDP: $246.9 billion
Click NEXT to read more...
World's 25 most innovative nations, India way behind!
9. Ireland
Score: 58.7
Ireland is ranked 9th, up four positions from 13th place in 2011. Ireland has been particularly good at prioritising those areas that convert it into an attractive destination for investments.
With good scores in institutions (4th), human capital and research (7th), access to credit (4th) and investor's protection (5th), it ranks 4th in venture capital deals, and 1st in exports of goods and services.
Innovation Output Sub-Index: 49.9
Innovation Input Sub-Index: 67.4
Innovation Efficiency Index: 0.7
Knowledge & technology outputs: 60.9 (Rank 6)
Knowledge creation: 54.2 (Rank 20)
GDP per capita: $39,507.9
GDP: $222.3 billion
Click NEXT to read more...
World's 25 most innovative nations, India way behind!
10. United States of America
Score: 57.7
The United States is ranked at tenth position, down from 7th place in 2011. Its drop in the rankings is the result of a relatively poorer performance on the output side, where it comes in at 16th in 2012, down from 5th in 2011.
Its bright areas are in market (2nd) and business sophistication (9th).
In knowledge and technology outputs, the USA has improved its ranking only in FDI net out flows (from position 27 to 22, with an increase from 1.90% to 2.41% of GDP), maintaining its positions in PCT applications (14th), computer software spending (7th), and royalty & license fees receipts (9th), with deteriorating positions in the remaining five indicators.
Human capital and research is at 22nd, down from 13th in 2011.
Innovation Output Sub-Index: 49.1
Innovation Input Sub-Index: 66.3
Innovation Efficiency Index: 0.7
Knowledge & technology outputs: 56.1 (Rank 11)
Knowledge creation: 66.8 (Rank 9)
GDP per capita: 48,147.2
GDP: $15,064.8 billion
Click NEXT to read more...
World's 25 most innovative nations, India way behind!
11. Luxembourg
Score: 57.7
Innovation Output Sub-Index: 52.4
Innovation Input Sub-Index: 63.0
Innovation Efficiency Index: 0.8
Knowledge & technology outputs: 49.8
Knowledge creation: 50.3
GDP per capita: $84,829.3
GDP: $62.9 bn
Click NEXT to read more...
World's 25 most innovative nations, India way behind!
12. Canada
Score: 56.9
Innovation Output Sub-Index: 48.0
Innovation Input Sub-Index: 65.8
Innovation Efficiency Index: 0.7
Knowledge & technology outputs: 46.4 (Rank 22)
Knowledge creation: 56.5 (Rank 16)
GDP per capita: $40,457.6
GDP: $1,758.7 bn
Click NEXT to read more...
World's 25 most innovative nations, India way behind!
13. New Zealand
Score: 56.6
Innovation Output Sub-Index: 49.9
Innovation Input Sub-Index: 63.4
Innovation Efficiency Index: 0.8
Knowledge & technology outputs: 49.2 (Rank 19)
Knowledge creation: 75.7 (Rank 5)
GDP per capita: $27,966.8
GDP: $168.8 billion
Click NEXT to read more...
World's 25 most innovative nations, India way behind!
14. Norway
Score: 56.4
Innovation Output Sub-Index: 48.8
Innovation Input Sub-Index: 64.0
Innovation Efficiency Index: 0.8
Knowledge & technology outputs: 42.1
Knowledge creation: 55.7 (17)
GDP per capita: $53,376.2
GDP: $479.3 billion
Click NEXT to read more...
World's 25 most innovative nations, India way behind!
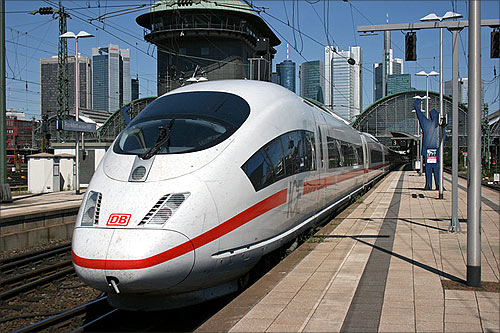
15. Germany
Score: 56.2
Innovation Output Sub-Index: 53.7
Innovation Input Sub-Index: 58.8
Innovation Efficiency Index: 0.9
Knowledge & technology outputs: 54.9
Knowledge creation: 71.1
GDP per capita: $37,935.5
GDP: $3,628.6 billion
Click NEXT to read more...
World's 25 most innovative nations, India way behind!
16. Malta
Score: 56.1
Innovation Output Sub-Index: 57.0
Innovation Input Sub-Index: 55.3
Innovation Efficiency Index: 1.0 4
Knowledge & technology outputs: 53.1 (Rank 14)
Knowledge creation: 35.8 (Rank 37)
GDP per capita: $25,782.7
GDP: $9.3 billion
Click NEXT to read more...
World's 25 most innovative nations, India way behind!
17. Israel
Score: 56.0
Innovation Output Sub-Index: 50.5
Innovation Input Sub-Index: 61.5
Innovation Efficiency Index: 0.8
Knowledge & technology outputs: 57.2 (Rank 10)
Knowledge creation: 72.9 (Rank 6)
GDP per capita: 31,004.6
GDP: $245.3 billion
Click NEXT to read more...
World's 25 most innovative nations, India way behind!
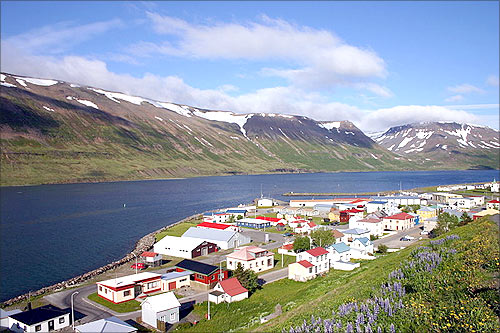
18. Iceland
Score: 55.7
Innovation Output Sub-Index: 50.6
Innovation Input Sub-Index: 60.8
Innovation Efficiency Index: 0.8
Knowledge & technology outputs: 45.5
Knowledge creation: 64.4
GDP per capita: $38,079.6
GDP: $14.1 billion
Click NEXT to read more...
World's 25 most innovative nations, India way behind!
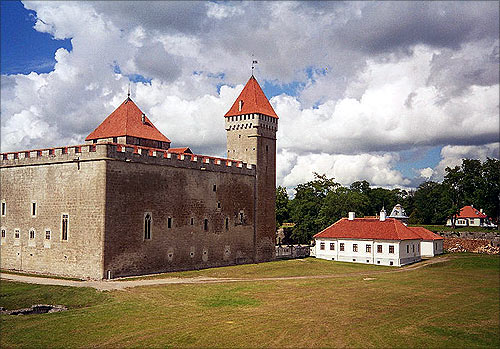
19. Estonia
Score: 55.3
Innovation Output Sub-Index: 53.3
Innovation Input Sub-Index: 57.4
Innovation Efficiency Index: 0.9
Knowledge & technology outputs: 53.8
Knowledge creation: 55.3
GDP per capita: $20,182.1
GDP: $22.5 billion
Click NEXT to read more...
World's 25 most innovative nations, India way behind!
20. Belgium
Score: 54.3
Innovation Output Sub-Index: 48.3
Innovation Input Sub-Index: 60.3
Innovation Efficiency Index: 0.8
Knowledge & technology outputs: 50.6 (Rank 17)
Knowledge creation: 57.7 (Rank 15)
GDP per capita: $37,677.4
GDP: $529 billion
Click NEXT to read more...
World's 25 most innovative nations, India way behind!
21. Republic of Korea
Score: 53.9
Innovation Output Sub-Index: 45.9
Innovation Input Sub-Index: 61.8
Innovation Efficiency Index: 0.7
Knowledge & technology outputs: 57.5 (Rank 9)
Knowledge creation: 81.5 (Rank 3)
GDP per capita: $31,753.5
GDP: $1,163.8 billion
Click NEXT to read more...
World's 25 most innovative nations, India way behind!
22. Austria
Score: 53.1
Innovation Output Sub-Index: 46.7
Innovation Input Sub-Index: 59.5
Innovation Efficiency Index: 0.8
Knowledge & technology output: 41.4 (Rank 28)
Knowledge creation: 50.8 (Rank 22)
GDP per capita: $41,805.1
GDP: $425.1 bn
Click NEXT to read more...
World's 25 most innovative nations, India way behind!
23. Australia
Score: 51.9
Innovation Output Sub-Index: 40.4
Innovation Input Sub-Index: 63.4
Innovation Efficiency Index: 0.6
Knowledge & technology outputs: 34.9 (Rank 43)
Knowledge creation: 43.7 (Rank 31)
GDP per capita: $40,836.4
GDP: $1,507.4 bn
Click NEXT to read more...
World's 25 most innovative nations, India way behind!
24. France
Score: 51.8
Innovation Output Sub-Index: 44.4
Innovation Input Sub-Index: 59.1
Innovation Efficiency Index: 0.8
Knowledge & technology outputs: 45.5 (Rank 23)
Knowledge creation: 45.5 (Rank 30)
GDP per capita: $35,048.8
GDP: $2,808.3 billion
Click NEXT to read more...
World's 25 most innovative nations, India way behind!
25. Japan
Score: 51.7
Innovation Output Sub-Index: 42.0
Innovation Input Sub-Index: 61.3
Innovation Efficiency Index: 0.7
Knowledge & technology outputs: 51.7 (Rank 15)
Knowledge creation: 62.5 (Rank 14)
GDP per capita: $34,362.1
GDP: $5,855.4 billion
Click NEXT to read more...

