 | « Back to article | Print this article |
UPA's decade of growth the highest for India
Figures don't lie. And they say the UPA's 10 years of economic growth is slightly better than the previous 10 years of growth. End of debate.
As India hurtles towards what is being drummed up as a crucial election, you will be convinced that either the country is in the dumps or shining like a beacon in the world -- depending on who you talk to.
But facts, like Shakira's hips, don't lie, if you'll excuse the word play.
While it cannot be denied that policy paralysis and rampant corruption have turned global investors away from India and it seems to have lost out to China in the Asian giants' race, a cursory look India's Gross Domestic Product growth throws up a startling fact: India's GDP (at factor cost, which is GDP minus indirect taxes , plus subsidies) grew the fastest in United Progressive Alliance rule.
Yes, you read that right: The country has seen the highest GDP growth since Independence between the financial years 2004-2005 and 2012-2013.
Undoubtedly, India has seen some of the worst times in the six years since the global financial crisis that started in 2008. And India's economic growth in the financial year 2013-2014 is expected to be the slowest in the entire decade.
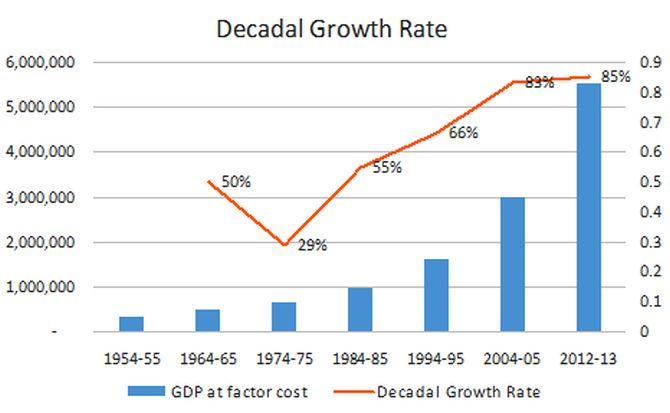
But in the last eight years alone (2004-2005 to 2012-2013), the country has seen its GDP rise 85 per cent, compared to the growth rate of 83 per cent in the previous decade (1994-1995 to 2004-2005), the bulk of which saw the National Democratic Alliance in power in New Delhi.
Here is India's GDP growth rate decade-on-decade. And if you study that orange line, you will also be able to connect that the drastic fall India's GDP saw in the years between 1964 and 1975 was probably responsible for the immense social unrest it witnessed around that period, with Naxalbari, Navnirman movement etc:
| Decade | GDP at factor cost (Rs crore) |
| 1954-1955 | 325,431 |
| 1964-1965 | 488,247 |
| 1974-1975 | 628,079 |
| 1984-1985 | 973,357 |
| 1994-1995 | 1,619,694 |
| 2004-2005 | 2,971,465 |
| 2012-2013 | 5,505,437 |
