Photographs: Erik de Castro/Reuters.
While New Zealand, Israel, and the United States have witnessed a widening gap between the rich and the poor, Turkey and Chile have more equitable distribution of wealth.
In a study by the Organisation for Economic Co-operation and Development (OECD), inequality is measured using the Gini coefficient. Business Insider lists 16 most unequal countries based on an OECD study.
(The larger the Gini coefficient, the more unequal a country is. A positive annual change means the country is becoming more unequal. The list pertains to OECD countries only.)
...
Rich-poor gap: World's 16 most unequal nations
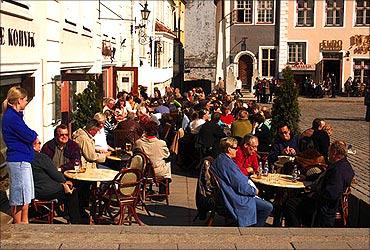
Image: Estonia.Gini coefficient: 0.31
Estonia is ranked as a high-income economy by the World Bank.The United Nations lists Estonia as a developed country with a high development index.
The country scores high on press freedom, economic freedom, democracy and political freedom and education.
Rich-poor gap: World's 16 most unequal nations
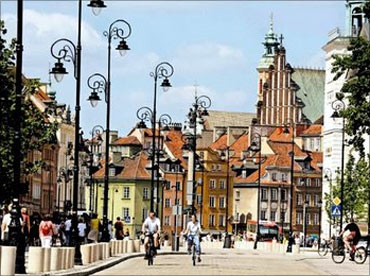
Image: Poland.Poland (Rank 15)
Gini coefficient: 0.31
Poland's high-income economy is considered to be one of the healthiest of the post-Communist countries.
It is also one of the fastest growing nations in the European Union.
Rich-poor gap: World's 16 most unequal nations
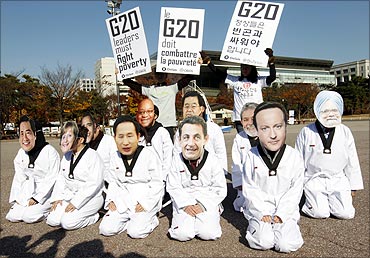
Image: Oxfam protesters wearing masks of G20 leaders urging them to fight poverty in Seoul.Gini coefficient: 0.32
Korea was a unified state until 1948, after which it was split into North Korea and South Korea.
South Korea, officially the Republic of Korea, is a developed country, with memberships in the United Nations, WTO, OECD and G-20.
Rich-poor gap: World's 16 most unequal nations
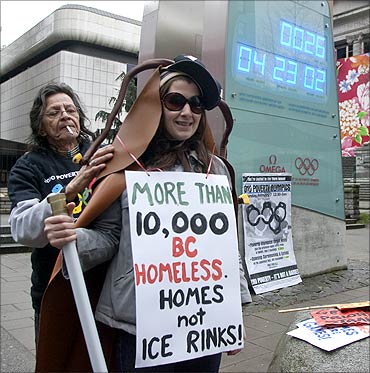
Image: An anti-poverty protestor dressed as a cockroach, prepares to take part in a rally in Vancouver.Gini coefficient: 0.32
One of the world's highly developed countries, Canada has a diversified economy With the eighth-highest human development index globally, it has one of the highest standards of living in the world.
The annual change in the Gini coefficient from mid-1980s to late 2000s is positive at 0.4 per cent.
(A positive annual change highlights the country is becoming more unequal.)
Rich-poor gap: World's 16 most unequal nations
Image: A beggar with her child in Athens.Photographs: Yannis Behrakis/Reuters.
Gini coefficient: 0.32
Greece is a developed country with a high-income economy and human development index. It also ranks consistently high in quality of life rankings.
Rich-poor gap: World's 16 most unequal nations
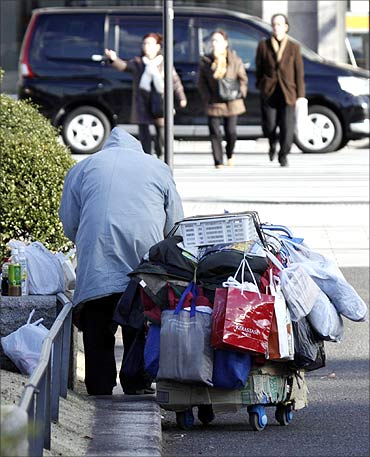
Image: A homeless man packs up his belongings on a street in Tokyo.Photographs: Toru Hanai/Reuters.
Gini coefficient: 0.33
A major economic power, Japan has the world's third-largest economy by nominal GDP and by purchasing power parity.
However, Japan's gross domestic product (GDP) growth will slow to 0.8 per cent through 2011 due to the devastating earthquake and tsunami.
The annual change in the Gini coefficient is positive at 0.4 per cent.
Rich-poor gap: World's 16 most unequal nations
Image: New Zealand.Gini coefficient: 0.33
New Zealand has a modern, prosperous and developed market economy.
It was ranked the third 'most developed' country in 2010 according to the United Nations Development Programme's Human Development Index.
The annual change in the Gini coefficient is positive at 0.9 per cent.
Rich-poor gap: World's 16 most unequal nations
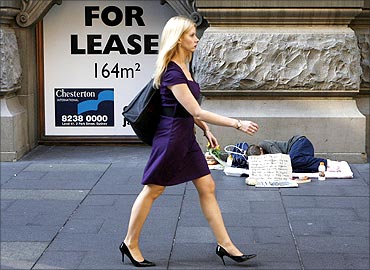
Image: An office worker walks next to a homeless woman in central Sydney.Photographs: Daniel Munoz/Reuters.
Gini coefficient: 0.34
Australia, the world's thirteenth largest economy ranks high on human development, quality of life, health care, life expectancy, public education and economic freedom.
The annual change in the Gini coefficient from mid-1980s to late 2000s is positive at 0.6 per cent.
Rich-poor gap: World's 16 most unequal nations
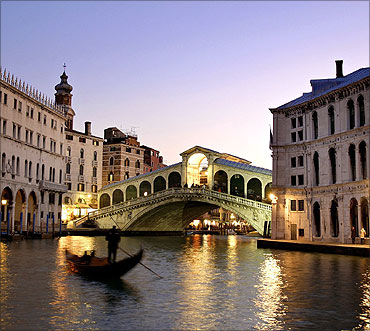
Image: Italy.Gini coefficient: 0.34
Italy has been ranked as the world's twenty-third most-developed country and its quality of life index has been ranked among the top ten in the world.
Italy also boasts of a high standard of living. The annual change in the Gini coefficient from mid-1980s to late 2000s is positive at 0.4 per cent.
Rich-poor gap: World's 16 most unequal nations
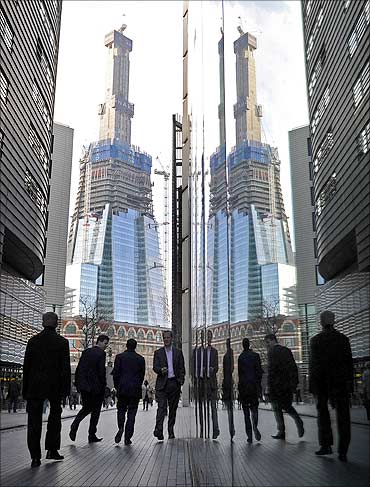
Image: London.Photographs: Reuters.
Gini coefficient: 0.34
A highly developed country, it is the world's sixth largest economy by nominal GDP and eighth largest economy by purchasing power parity.
The annual change in the Gini coefficient from mid-1980s to late 2000s is positive at 0.8 per cent.
Rich-poor gap: World's 16 most unequal nations
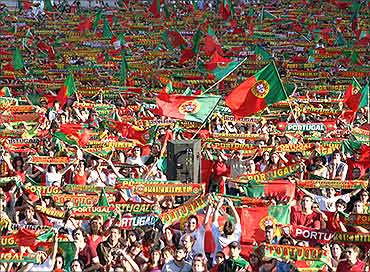
Image: Portugal.Gini coefficient: 0.36
The annual change in the Gini coefficient mid-1980s to late 2000s is negative at 0.2 per cent.
Portugal is a developed country and a high-income economy. It scores high in the high human development index. It ranks ninth in terms of quality of life.
Rich-poor gap: World's 16 most unequal nations
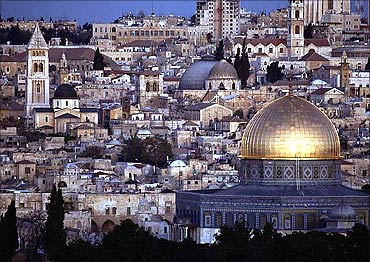
Image: Israel.Israel (Rank 5)
Gini coefficient: 0.37
Israel is a developed country, which scores high in the human development index.
It has one of the highest life expectancies in the world. The annual change in the Gini coefficient from the mid-1980s to late 2000s is positive at 0.6 per cent.
Rich-poor gap: World's 16 most unequal nations
Image: Washington.Gini coefficient: 0.38
The world's largest national economy, United States has one of the widest rich-poor gaps of any high-income nation.
The standard of living in the United States is one of the top 20 in the world. The per capita income is high but less evenly distributed than in other developed countries.
The annual change in the Gini coefficient mid-1980s to late 2000s is positive at 0.5 per cent.
Rich-poor gap: World's 16 most unequal nations
Image: Turkey.Gini coefficient: 0.41
Turkey has the world's 15th largest GDP. The country is a founding member of the OECD and the G-20 major economies.
The annual change in the Gini coefficient mid-1980s to late 2000s is negative at 0.3 per cent.
...
Rich-poor gap: World's 16 most unequal nations
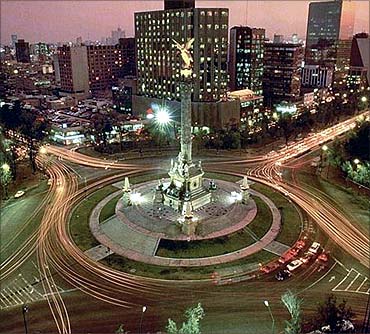
Image: Mexico.Gini coefficient: 0.48
Mexico is both one of the world's largest economies and a regional power.
Mexico, a newly industrialised country has the 13th largest nominal GDP and the 11th largest by purchasing power parity.
The annual change in the Gini coefficient mid-1980s to late 2000s is positive at 0.2 per cent.
Rich-poor gap: World's 16 most unequal nations
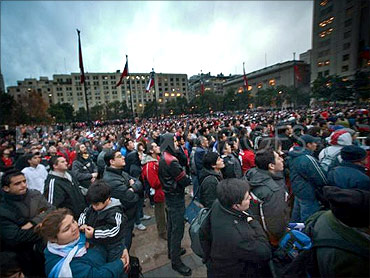
Image: Chile.Gini coefficient: 0.5
Chile is one of South America's most stable and prosperous nations.
It leads in human development, competitiveness, income per capita, globalisation and economic freedom among Latin American nations. The annual change in the Gini coefficient from the mid-1980s to late 2000s is negative at 0.5 per cent.






article