 | « Back to article | Print this article |
Jobs: South Asian nations that are booming
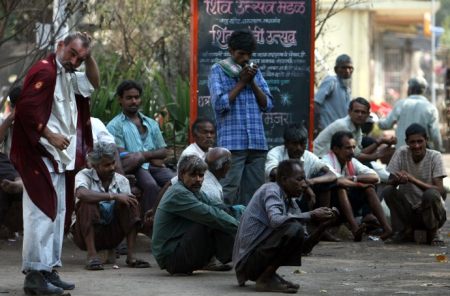
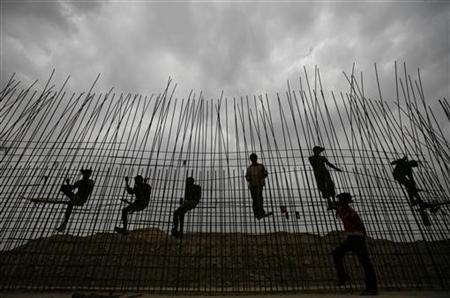
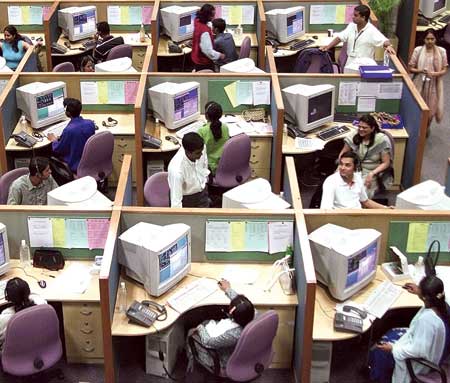
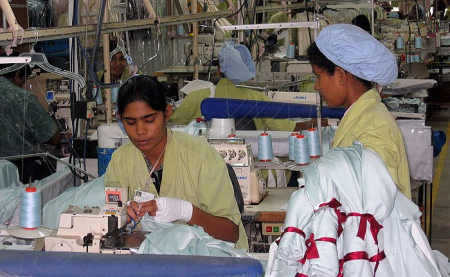
While workers in the United States and Europe are having a difficult time in not only finding a job but also keeping it, the situation in South Asia, including India, is somewhat different.
According to the World Bank, job creation in South Asia averaged just fewer than 800,000 a month between 2000 and 2010.
Real wages rose for wage workers, and poverty declined for the self-employed, as well as other types of workers.
Wages and poverty are the primary criteria for improved job quality that guide the analysis. A reduced risk of low and uncertain income for the most vulnerable group of workers is a secondary criterion for improved job quality.
The improvement in job quality has been associated with accelerating economic growth in Bangladesh and India since the 1980s.
In Nepal, where growth has been slow over several decades, it is massive out migration in response to limited opportunities at home that has improved labor market prospects for those who remain.
Workers' remittances have reduced poverty across a wide swath of households.
Let us have a look at the labour situation in South Asia, with particular emphasis on India.
Click NEXT to read more...
Jobs: South Asian nations that are booming
Annual growth in working-age population, employment and labour force in selected South Asian countries
India 1985-2010
Working age population: 2.3 per cent
Employment: 2.2 per cent
Labour force: 2.2 per cent
Click NEXT to read more...
Jobs: South Asian nations that are booming
Pakistan 2000-2010
Working age population: 2.9 per cent
Employment: 3.6 per cent
Labour force: 3.6 per cent
Click NEXT to read more...
Jobs: South Asian nations that are booming
Bangladesh 2000-2010
Working age population: 2.3 per cent
Employment: 2.5 per cent
Labour force: 2.6 per cent
Click NEXT to read more...
Jobs: South Asian nations that are booming
Sri Lanka 2000-2010
Working age population: 1.0 per cent
Employment: 1.2 per cent
Labour force: 1.0 per cent
Click NEXT to read more...
Jobs: South Asian nations that are booming
Nepal 1995-2010
Working age population: 2.8 per cent
Employment: 3.3 per cent
Labour force: 3.3 per cent
Click NEXT to read more...
Jobs: South Asian nations that are booming
Distribution of employment by type in South Asia, by country
India 2010
Self-employed (low end): 43 per cent
Self-employed (high end): 8 per cent
Casual wage: 32 per cent
Regular wage and salaried: 17 per cent
Click NEXT to read more...
Jobs: South Asian nations that are booming
Pakistan 2009
Self-employed (low end): 50 per cent
Self-employed (high end): 13 per cent
Casual wage: 17 per cent
Regular wage and salaried: 21 per cent
Click NEXT to read more...
Jobs: South Asian nations that are booming
Bangladesh 2005
Self-employed (low end): 62 per cent
Self-employed (high end): 2 per cent
Casual wage: 22 per cent
Regular wage and salaried: 14 per cent
Click NEXT to read more...
Jobs: South Asian nations that are booming
Sri Lanka 2008
Self-employed (low end): 34 per cent
Self-employed (high end): 9 per cent
All wages: 57 per cent
Click NEXT to read more...
Jobs: South Asian nations that are booming
Nepal 2008
Self-employed (low end): 80 per cent
Self-employed (high end): 2 per cent
Casual wage: 10 per cent
Regular wage and salaried: 8 per cent
Click NEXT to read more...
Jobs: South Asian nations that are booming
Average annual increases in mean real wages in selected countries in South Asia
India 1983-2010: 2.8 per cent
Pakistan 2000-2009: 2.0 per cent
Bangladesh 2002-2005: 1.9 per cent
Sri Lanka 2000-2008: 0.1 per cent
Nepal 1999-2008: 2.9 per cent
Click NEXT to read more...
Jobs: South Asian nations that are booming
Average number of months without work in the past year, casual labourers in India, 2009-2010, by sector
Agriculture: 1.4 months
Rural non-farm: 1.1 months
Urban: 0.9 months
Click NEXT to read more...
Jobs: South Asian nations that are booming
Share of rural and urban workers in India
Rural 2009-2010
Casual labour: 38 per cent
Self employed: 54 per cent
Regular wage or salaried: 8 per cent
Click NEXT to read more...
Jobs: South Asian nations that are booming
Urban 2009-2010
Casual labour: 17 per cent
Self employed: 41 per cent
Regular wage or salaried: 43 per cent
Click NEXT to read more...
Jobs: South Asian nations that are booming
Annual growth in GDP per capita, by region, 2001-2010
South Asia: 5.9 per cent
East Asia and Pacific: 8.4 per cent
Latin America and Caribbean: 2.8 per cent
Middle East and North Africa: 3.0 per cent
Sub-Saharan Africa: 2.5 per cent
Click NEXT to read more...
Jobs: South Asian nations that are booming
Annual growth in GDP per capita in South Asia, by country, 2001-2010
India: 6.6 per cent
Pakistan: 2.8 per cent
Bangladesh: 4.3 per cent
Sri Lanka: 4.9 per cent
Nepal: 1.9 per cent
Click NEXT to read more...
Jobs: South Asian nations that are booming
Severity of constraints reported by South Asian benchmark firm in the urban formal sectors
i) Political instability
ii) Telecoms
iii) Courts
iv) Business licensing
v) Transport
Note: A benchmark firm is a medium size manufacturing firm with 30 employees that is domestically owned, does not export or import, is located in a large city, and did not expand employment in the preceding three years.
Click NEXT to read more...
Jobs: South Asian nations that are booming
Top five constraints reported by Indian benchmark firm in the urban formal sector
India
i) Electricity
ii) Corruption
iii) Tax administration
iv) Labour regulations
v) Labour skills
Click NEXT to read more...
Jobs: South Asian nations that are booming
Per cent of Indian firms expected to give gifts to public officials, by type of interaction
Construction permit: 67 per cent
Meeting with tax officials: 57 per cent
Operating licence: 55 per cent
Import licence: 48 per cent
Electrical connection: 38 per cent
Water connection: 26 per cent
Government contracts: 24 per cent
Phone connection: 19 per cent
Click NEXT to read more...
Jobs: South Asian nations that are booming
Weeks of wages paid in severance by selected length of service.
India
One-year service: 2 weeks
Five-year service: 11 weeks
10-year service: 21 weeks
Click NEXT to read more...
Jobs: South Asian nations that are booming
Pakistan
One-year service: 4 weeks
Five-year service: 21 weeks
10-year service: 43 weeks
Click NEXT to read more...
Jobs: South Asian nations that are booming
Bangladesh
One-year service: 5 weeks
Five-year service: 25 weeks
10-year service: 50 weeks
Click NEXT to read more...
Jobs: South Asian nations that are booming
Sri Lanka
One-year service: 11 weeks
Five-year service: 54 weeks
10-year service: 98 weeks
Click NEXT to read more...
Jobs: South Asian nations that are booming
Nepal
One-year service: 4 weeks
Five-year service: 21 weeks
10-year service: 43 weeks

