 | « Back to article | Print this article |
India slips two positions on global innovation index
India drops two places from its last year’s position on the Global Innovation Index 2013. The index, which ranks 142 countries across the world on their innovation capacity and efficiency, is published by Cornell University, INSEAD, World Intellectual Property Organisation and Confederation of Indian Industry.
Let’s take a look at India’s and top 20 countries’ ranking on the Global Innovation Index 2013.
Click NEXT to see India’s rank…
India slips two positions on global innovation index
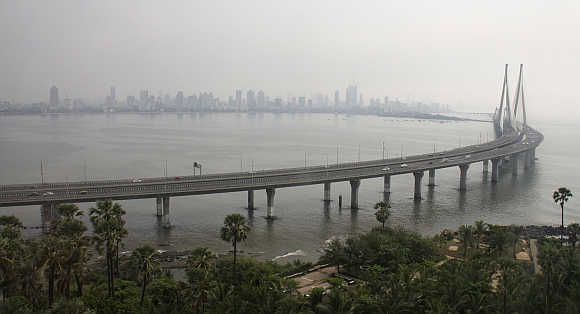
India
Score (0–100): 36.17
Global ranking: 66
India's low ranking in parameters such as political stability (rank 123), ease of starting business (rank 128), school life expectancy (rank 109), pupil-teacher ratio (rank 108) and knowledge absorption (rank 122) was instrumental in its downward journey.
Click NEXT to see the top 20 countries...
India slips two positions on global innovation index
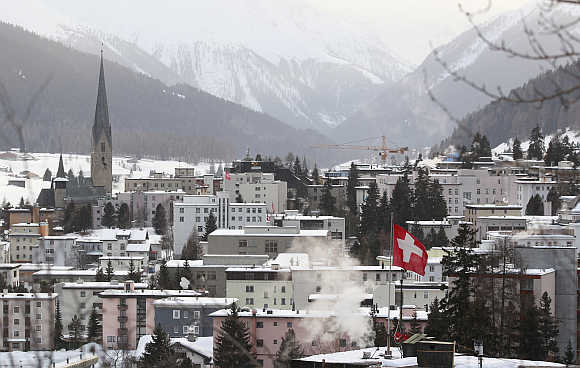
Switzerland
Score (0–100): 66.59
Global ranking: 1
Switzerland maintains its 2011 and 2012 position as number one in the GII, as well as its 2012 first position in the innovation output sub-index and in knowledge and technology outputs and its second place in creative outputs.
Click NEXT to read more...
India slips two positions on global innovation index
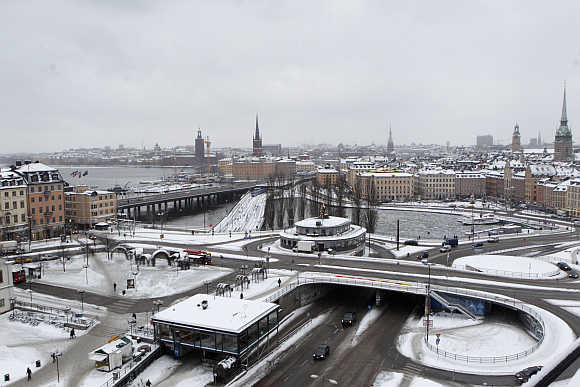
Sweden
Score (0–100): 61.36
Global ranking: 2
The runner-up, Sweden, retains the position it held in 2011 and 2012 and leads among Nordic and European Union countries. It ranks fifth on inputs and third on outputs, with strengths in all seven pillars (its lowest rank is 12th in creative outputs).
Click NEXT to read more...
India slips two positions on global innovation index
United Kingdom
Score (0–100): 61.25
Global ranking: 3
The United Kingdom occupies third place in 2013 (up from fifth in 2012 and 10th in 2011), and comes in fourth in both inputs and outputs. The UK places within the top 25 in 15 of the 20 indicators that have been adjusted or introduced this year.
Click NEXT to read more...
India slips two positions on global innovation index
The Netherlands
Score (0–100): 61.14
Global ranking: 4
The Netherlands is ranked fourth, up from sixth in 2012 and ninth in 2011, with a clear relative advantage again this year on outputs, where it is ranked second (third in 2012).
Click NEXT to read more...
India slips two positions on global innovation index
The United States
Score (0–100): 60.31
Global ranking: 5
The United States of America is ranked fifth, up from 10th in 2012, and leads the rankings in Northern America. This remarkable jump reflects the relative strength of the country in the 20 indicators introduced this year.
Click NEXT to read more...
India slips two positions on global innovation index
Finland
Score (0–100): 59.51
Global ranking: 6
Finland is ranked sixth in the GII this year (fourth in 2012), sixth in the input sub-index, and eight in the output sub-index. It achieves positions among the top 25 in all pillars, 16 out of 21 sub-pillars, and 56 out of 82 indicators with data.
Click NEXT to read more...
India slips two positions on global innovation index
Hong Kong
Score (0–100): 59.43
Global ranking: 7
Hong Kong is ranked seventh this year, up one position from eighth in 2012 and taking the lead from Singapore among Asian economies. With a population of 7.5 million and a GDP per capita of $50,708.9, its major leverage comes from the input sub-index, where it ranks second after Singapore.
Click NEXT to read more...
India slips two positions on global innovation index
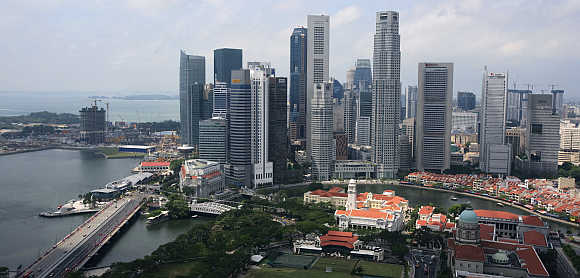
Singapore
Score (0–100): 59.41
Global ranking: 8
Singapore is ranked eighth, down five positions from its third place in 2012. Singapore is one of the four economies at the efficient frontier.
Click NEXT to read more...
India slips two positions on global innovation index
Denmark
Score (0–100): 58.34
Global ranking: 9
Denmark is ranked ninth, down two positions from seventh place in 2012. The strength of this country of 5.8 million people is in the input sub-index (eighth), with a 14th position in the output sub-index.
Click NEXT to read more...
India slips two positions on global innovation index
Ireland
Score (0–100): 57.91
Global ranking: 10
Ireland is ranked 10th, down from ninth in 2012; it is 12th in the input sub-index and 11th in the output sub-index.
Click NEXT to read more...
India slips two positions on global innovation index
Canada
Score (0–100): 57.60
Global ranking: 11
Canada is ranked 11th, up from 12th in 2012. It ranks ninth overall in the input sub-index and 13th in the output sub-index, with strong positions across the board.
Click NEXT to read more...
India slips two positions on global innovation index
Luxembourg
Score (0–100): 56.57
Global ranking: 12
Luxembourg is ranked 12th in the GII, down from 11th in 2012. With a population of 0.5 million and a GDP per capita of $80,679.1, it achieves 18th position in the input sub-index.
Click NEXT to read more...
India slips two positions on global innovation index
Iceland
Score (0–100): 56.40
Global ranking: 13
Iceland is ranked 13th, up five positions from 18th in 2012. This Nordic country of 0.3 million people ranks 21st in the Input Sub-Index and seventh in the output sub-index.
Click NEXT to read more...
India slips two positions on global innovation index
Israel
Score (0–100): 55.98
Global ranking: 14
Israel is ranked 14th, up three positions from 17th in 2012. It has leader positions across the board, ranking 19th in the input sub-index and ninth in the output sub-index, and first in its region.
Click NEXT to read more...
India slips two positions on global innovation index
Germany
Score (0–100): 55.83
Global ranking: 15
Germany is ranked 15th, maintaining its 2012 position. As has been the case for the past three years, Germany’s relative strength is in the output sub-index (10th).
Click NEXT to read more..
India slips two positions on global innovation index
Norway
Score (0–100): 55.64
Global ranking: 16
This year’s report provides a cautiously optimistic and yet highly contrasted view of innovation: on the one hand, spending and investment in R&D and innovation has been sustained in spite of the crisis.
Click NEXT to read more...
India slips two positions on global innovation index
New Zealand
Score (0–100): 54.46
Global ranking: 17
On the other hand, innovation remains a spikily dispersed phenomenon, where many obstacles remain in the path of poorer economies.
Click NEXT to read more...
India slips two positions on global innovation index
South Korea
Score (0–100): 53.31
Global ranking: 18
In these countries, as in other parts of the world, a better understanding and appreciation of the local dynamics of innovation can clearly contribute to unleashing new sources of growth, competitiveness, and job creation.
Click NEXT to read more...
India slips two positions on global innovation index
Australia
Score (0–100): 53.07
Global ranking: 19
As stated at the start of this chapter, policies to promote innovation lay the foundation for future growth, productivity improvements, and better jobs.
Click NEXT to read more...
India slips two positions on global innovation index
France
Score (0–100): 52.83
Global ranking: 20
Opportunities for new sources of innovation-based growth abound in fields such as education, the environment, energy, food, health, information technologies, and transport, among others.

