Photographs: Bazuki Muhammad/Reuters.
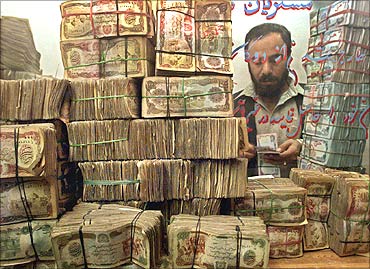
Asia continues to produce the largest portion of illicit flows, almost half-a-trillion dollars in 2008 alone, states the GFI study.
Illicit financial flows: Top 10 nations
Image: Illicit outflows rise.Illicit outflows increased from $1.06 trillion in 2006 to approximately $1.26 trillion in 2008, with average annual illicit outflows from developing countries averaging $725 billion to $810 billion, per year, over the 2000-2008 time period measured.
Asia accounted for 44.4 percent of total illicit flows from the developing world followed by Middle East and North Africa (17.9 per cent), developing Europe (17.8 per cent), Western Hemisphere (15.4 per cent), and Africa (4.5 per cent).
Click NEXT to find out the top 10 nations with highest illicit outflows
Illicit financial flows: Top 10 nations
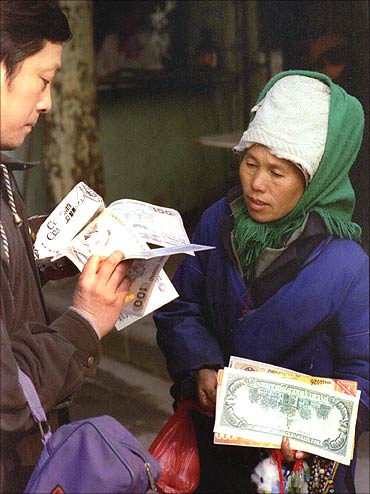
Image: A Chinese woman sells enlarged copies of various currency notes.Photographs: Reuters.
China tops the illicit outflow list. Between 2000 to 2008, the outflow of illicit money from China was a whopping $2.2 trillion.
Trade mispricing was found to account for an average of 54.7 percent of cumulative illicit flows from developing countries over the period 2000-2008 and is the major channel for the transfer of illicit capital from China, states the GFI study.
Illicit financial flows: Top 10 nations
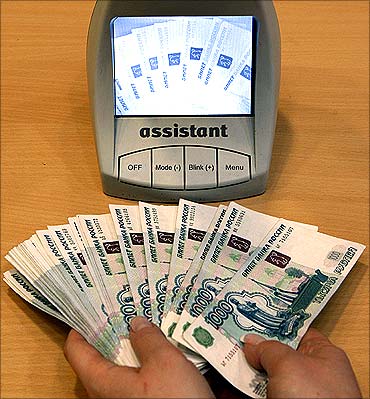
Image: An employee of a bank checks the authenticity of Russian rouble banknotes.Photographs: Reuters.
Oil exporting countries, like Russia, the United Arab Emirates, Kuwait, and Nigeria, are becoming more important as sources of illicit capital.
Russia lost $427 billion as illicit outflows.
Illicit financial flows: Top 10 nations
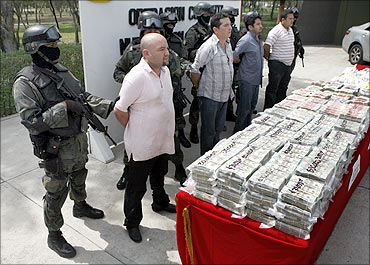
Image: Soldiers escort four detainees after seizing cash, drugs and vehicles.Photographs: Tomas Bravo/Reuters.
"Every year developing countries are losing ten times the amount of Official Development Assistance (ODA) remitted for poverty alleviation and economic development," said GFI director Raymond Baker.
Mexico lost $416 billon as illegal outflow. Mexico is the only oil exporter where trade mispricing was the preferred method of transferring illicit capital abroad.
Illicit financial flows: Top 10 nations
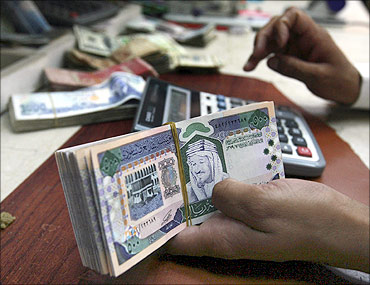
Image: A Saudi money exchanger counts Saudi riyals in Riyadh.Photographs: Reuters.
Oil-rich Saudi Arabia is at the fourth place with an illicit outflow at $302 billion. Bribery, theft, kickbacks, and tax evasion were the min reasons for the illicit outflow of money.
Illicit financial flows: Top 10 nations
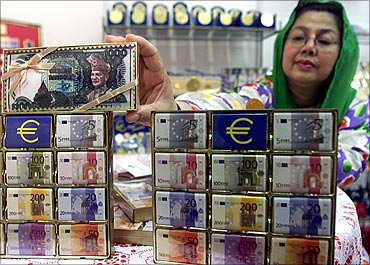
Image: Sharifah Azwan Jamulullail arranges chocolates wrapped with currency notes.Photographs: Zainal Abd Halim/Reuters.
Financial flows from Malaysia have more than tripled from $22.2 billion in 2000 to $68.2 billion in 2008.
Malaysia lost a staggering $291 billion.
This growth rate, seen in few Asian countries, may be a result of significant governance issues affecting both public and private sectors, says the GFI study.
Illicit financial flows: Top 10 nations
Image: Currency.The United Arab Emirates saw a huge loss of $276 billion.
The ratio of illicit financial flows coming out of developing countries compared to ODA is 10-1, meaning that for every $1 in economic development assistance which goes into a developing country, $10 is lost via these illicit outflows.
Illicit financial flows: Top 10 nations
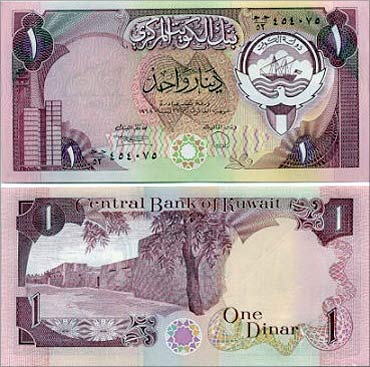
Image: Kuwait currency notes.Increasing transparency in the global financial system is critical to reducing the outflow of illicit money from developing countries, the GFI study states.
The Gulf state of Kuwait lost funds to the tune of $242 billion.
Illicit financial flows: Top 10 nations
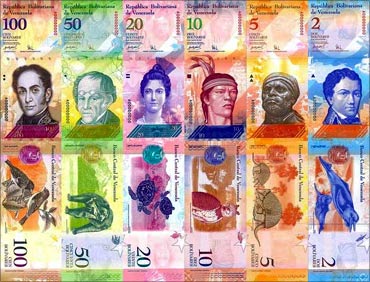
Image: Venezuela currency.Venezuela is ranked at the 8th position with a loss of $157 billion.
GFI suggests curbing trade mispricing for achieving greater transparency.
This would require country-by-country reporting of sales, profits and taxes paid by multinational corporations and confirmation of beneficial ownership in all banking and securities accounts,
Illicit financial flows: Top 10 nations
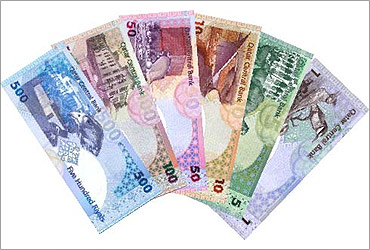
Image: Qatar currency.Qatar lost $138 billion to illicit financial outflows.
In a bid to reduce such outflows, GFI suggest automatic cross-border exchange of tax information on personal and business accounts.
Illicit financial flows: Top 10 nations
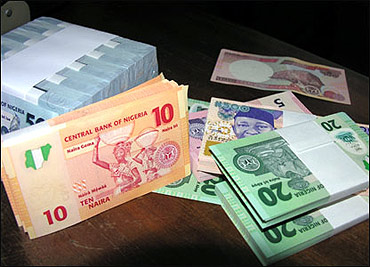
Image: Nigerian currency.Nigeria ranks tenth with a loss of $130 billion.
In real terms, illicit outflows through trade mispricing grew faster in the case of Africa (28.8 percent per annum) than anywhere else, possibly due to weaker customs monitoring and enforcement regimes.


article