 | « Back to article | Print this article |
Cities with world's highest and lowest carbon emission
"Many cities have very low emissions, as do many city dwellers in even the most industrialised countries, says lead author Daniel Hoornweg, lead urban specialist on Cities and Climate Change at the World Bank.
Many European cities have less than half the emissions per person of many cities in North America. Some wealthy cities in Brazil have lower emissions per person than poorer cities in Asia and Africa, according to a study by International Institute for Environment and Development. "From the production perspective Shanghai has high emissions but from the consumption perspective its emissions are much lower," the study says.High carbon emission has resulted in extreme weather conditions across the world. The variation in pattern of monsoons, rise in surface temperature, rise in sea level and melting of glaciers will drastically hit agriculture and food production.
"The world's wealthiest cities and their inhabitants that cause unsustainable levels of greenhouse gas emissions, not cities in general, says David Satterthwaite, editor of Environment and Urbanisation and a senior fellow at the International Institute for Environment and Development.
Knowledge Allianz lists cities on the basis of their carbon emission based on the IIED study... Click NEXT to find out more...
Cities with world's highest and lowest carbon emission
Per Capita Emissions: 0.6 tons
Bangladesh Average: 0.4 tons
Population: 12.6 million
Dhaka has low emissions per person as majority of the people are poor. Bangladesh's total emission is likely to rise to 70 million metric tons (mt) by 2015 and 150 million mt by 2030.
Bangladesh plans to reduce at least one third of total carbon emission by 2030.Click NEXT to read on
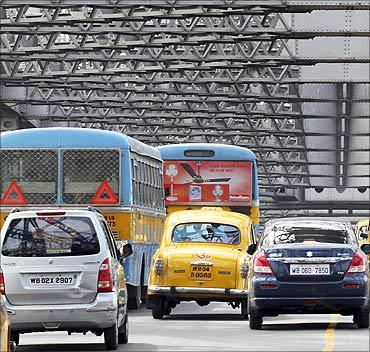
Cities with world's highest and lowest carbon emission
Per Capita Emissions: 1.1 tons
India Average: 1.3 tons
Population: 15.6 million
Click NEXT to read on
Cities with world's highest and lowest carbon emission
Per Capita Emissions: 1.4 tons
Brazil Average: 4.2 tons
Population: 20.1 million
Brazil has lower emissions per person than poorer cities in Asia. Cities like Sao Paulo are mostly powered by hydroelectric dams and people use biofuel-powered vehicles.
Click NEXT to read on
Cities with world's highest and lowest carbon emission
Per Capita Emissions: 3.6 tons
Sweden Average: 7.1 tons
Population: 2 million
Stockholm has highly energy-efficient buildings, a combined heat and power system, and uses wind, hydroelectric and biogas from waste to boost its energy needs.
Click NEXT to read on
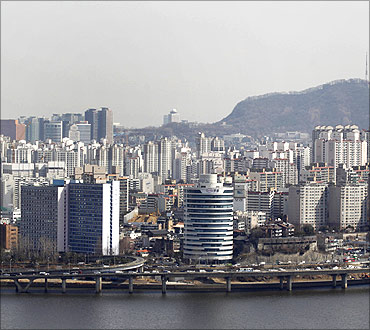
Cities with world's highest and lowest carbon emission
Per Capita Emissions: 4.1 tons
Korea Average: 11.5 tons
Population: 25 million
Click NEXT to read on
Cities with world's highest and lowest carbon emission
Per Capita Emissions: 4.2 tons
Spain Average: 9.9 tons
Population: 1.6 million
Barcelona has less than half the emissions per person compared to many cities in North America.
Click NEXT to read on
Cities with world's highest and lowest carbon emission
Per Capita Emissions: 4.9 tons
Japan Average: 10.8 tons
Population: 35.2 million
Tokyo is a compact city with an huge population, good public transportation and very energy efficient buildings, says the IIED study.
Click NEXT to read on
Cities with world's highest and lowest carbon emission
Per Capita Emissions: 7.6 tons
South Africa Average: 9.9 tons
Population: 3.5 million
Click NEXT to read on
Cities with world's highest and lowest carbon emission
Per Capita Emissions: 9.6 tons
UK Average: 10.5 tons
Population: 12 million
London has higher emissions per capita than many other European cities.
A rich city with a high-consumption lifestyle, it can have low per capita emissions from a production perspective, but very high emissions from consumption, according to the IIED report.Click NEXT to read on
Cities with world's highest and lowest carbon emission
Per Capita Emissions: 10.5 tons
USA Average: 23.6 tons
Population: 19 million
New York has plans to cut carbon emission by 30 percent by 2030 with more energy-efficient buildings and a congestion fee in city.
Click NEXT to read on
Cities with world's highest and lowest carbon emission
Per Capita Emissions: 10.7 tons
Thailand Average: 3.8 tons
Population: 11.9 million
Carbon emissions in Bangkok are a result of large number of vehicles and the presence of a large port and two international airports, says the IIED report.
Click NEXT to read on
Cities with world's highest and lowest carbon emission
Per Capita Emissions: 11.6 tons
Canada Average: 22.6 tons
Population: 5.5 million
Toronto shows a wide variation in per capita emissions. Peak summers see a rise in usage of air-conditioners leading to higher emission.
Click NEXT to read on
Cities with world's highest and lowest carbon emission
Per Capita Emissions: 11.7 tons
China Average: 3.4 tons
Population: 19.2 million
Chinese cities have the highest carbon emissions per capita and energy consumption per unit of GDP in Asia.
The IIED report says the carbon emissions are on an average are much higher than per capita national averages. A huge industrial base and increasing growth in the number of vehicles has made the situation worse.
Click NEXT to read on
Cities with world's highest and lowest carbon emission
Per Capita Emissions: 16 tons
Germany Average: 11.6 tons
Population: 600,000
The auto hub of the world, Stuttgart houses most of the automobile companies. With a large presence of rich people in the city, it is not surprising that emissions are growing at a fast rate.
Click NEXT to read on
Cities with world's highest and lowest carbon emission
Per Capita Emissions: 20.3 tons
Australia Average: 25.75 tons
Population: 4.5 million
Click NEXT to read on
Cities with world's highest and lowest carbon emission
Per Capita Emissions: 21.5 tons
National Average: 23.6 tons
Population: 600,000
Denver has high carbon emissions due to the cold climate and reliance on coal for its electricity.
Click NEXT to read on
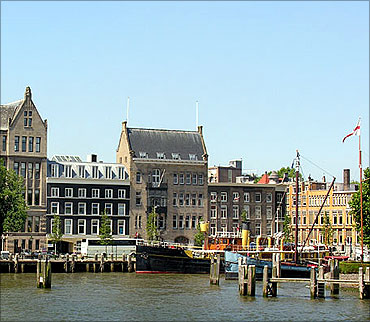
Cities with world's highest and lowest carbon emission
Netherlands Average: 12.7 tons
Population: 600,000
The highest carbon emission comes from a small population in Rotterdam. The shipping industry contributes significantly towards rising carbon emission in the city.


