But lower growth numbers in the quarters to come may not mean renewed weakness in the economy at the ground level, says Pranjul Bhandari.

It’s GDP season again. India’s new method of calculating GDP (gross domestic product) growth has been keeping us on our toes, springing a surprise with every release. But this time we are determined to stay ahead of the game. The economy has experienced dramatic changes in prices, which could impact growth as they normalise. So we dig deeper into the numbers to see what the future holds.
The bad news is that we believe economic growth has been overestimated in the last few quarters. The good news is that, first, this is likely to be temporary — the data will become more accurate as prices normalise over the next six quarters. Second, lower growth numbers in the quarters to come may not mean renewed weakness in the economy at the ground level. Let us explain what’s going on.
For most sectors, the statistics agency starts by calculating “gross value added” (GVA), a measure of economic growth in nominal terms. Put simply, GVA is equal to economic output minus input. It then deflates nominal GVA to get an estimate of real growth. This is where the trouble starts.
Instead of deflating output and input using their respective prices, the statistics agency uses a common output deflator for both. This use of what economists call single rather than double deflation does not cause much of a problem when input and output prices are moving in tandem. However, over the last few quarters, as global commodity prices plummeted, input prices in India have fallen much more than output prices.
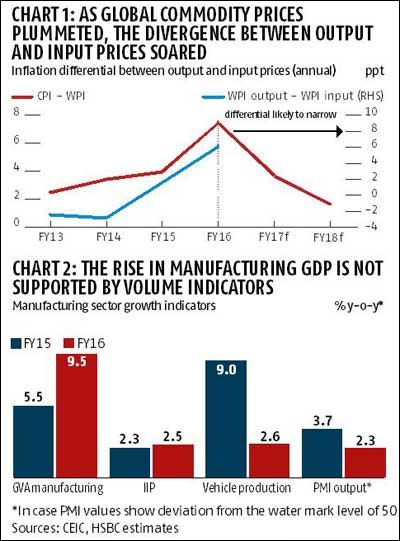
This can be seen in chart 1, which shows the divergence between the consumer price index (CPI, a proxy for output prices) and the wholesale price index (WPI, a proxy for input prices). We believe this has resulted in the exaggeration of real GVA growth.
 The culprit is the manufacturing sector. Advance estimates put manufacturing GVA growth at 9.5 per cent in FY16, significantly higher than the 5.5 per cent for FY15; other measures of manufacturing volume flat-lined or even deteriorated over the same period (chart 2). We dig deeper to attempt to quantify the likely level of overestimation in manufacturing growth.
We begin by getting a handle on input prices. These data points are not readily available and need to be calculated by breaking down WPI inflation into its input constituents. Next, we estimate manufacturing growth based on two scenarios - single and double deflation. We find that in FY15, manufacturing growth may have been exaggerated by 120 basis points (bps).
Applying FY15 sensitivities to the following year, we find that manufacturing growth was exaggerated by 450 bps in FY16. This means that instead of the 9.5 per cent year-on-year reported growth in manufacturing, actual growth is likely to have been closer to five per cent year-on-year.
Translating this to overall GDP growth suggests an overestimation of 80 bps (6.5 per cent instead of 7.3 per cent). This is not surprising, as the record divergence between output and input prices that year amplified the error caused by using single instead of double deflation.
Fortunately, this problem is likely to go away. Thanks largely to a low base, input price inflation could climb even if commodity prices do not rise dramatically. The gap between CPI and WPI inflation is already closing, as is the gap between WPI output and input prices.
Our forecasts suggest that the gap in relative prices is likely to return to normal (the long-term average) by mid-2017. This implies that the 450 bps overestimation in manufacturing growth should narrow over the next six quarters.
Something similar happened after the 2008 global financial crisis. Global commodity prices plummeted for a few quarters, which led to a divergence in output and input prices. The practice of single deflation exaggerated manufacturing growth (11.3 per cent year-on-year in FY10), only to fall sharply two years later. This time around, as manufacturing GDP begins to track the action on the ground more accurately, the moderation in growth should not be interpreted as renewed weakness.
While data is normalising after the price shock, how should we track real growth? Volume indicators will help provide the answer and thankfully, there are plenty to choose from, including the industrial production index, the manufacturing purchasing managers’ index, car sales and transport services. The statistics agency already uses various volume indicators to estimate quarterly GVA, so releasing a consolidated index would not be much of an extra effort.
Finally, will there be a significant fall in GDP growth as the overestimates start to disappear from the data? We don’t think so. While manufacturing growth is likely to soften over the next six quarters, a similar rise in agricultural growth due to normal monsoon rains could offset the fall. After all, the share of manufacturing and agriculture in India’s GDP are not too different (17 per cent and 15 per cent, respectively).
We expect headline GDP growth to be flat at 7.4 per cent year-on-year in FY17. While normalising manufacturing growth and banking sector stress are likely to be a drag, a bounce-back in agriculture, alongside the ongoing consumption revival, could just about offset the slowdown.
Consensus forecasts that put GDP growth much higher over the next year may be in for some disappointment.
Pranjul Bhandari is chief India economist, HSBC
Photograph: PTI


 © 2025